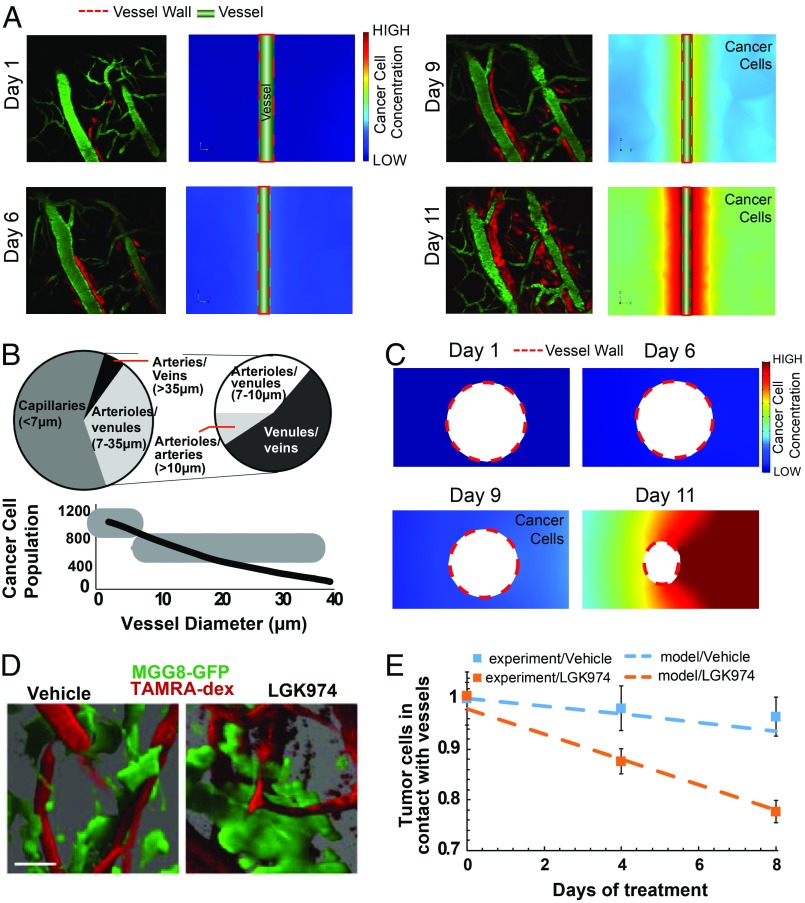
Fig. 4.
Comparison between experimental data and the mathematical model of dynamics of vessel cooption. (A) Model simulations were compared with experimental data (1) for the temporal evolution of vessel cooption around a single vessel. Red represents glioblastoma cells (DsRed-expressing CNS-1 cells), and green represents perfused blood vessels (FITC-dextran injected intravenously). In our model, we adjusted the migration/diffusion coefficient of cancer cells to match the experimental observations of cooption (Color scale: low, 0; high, 18, dimensionless units). Reprinted from ref. 1. Copyright (2014), with permission from Elsevier. (Magnification: 200×.) (B) The decrease in vessel diameter as a function of the number of cancer cells attached to the vessel wall agrees well with published experimental data for D54 glioma cells found in ref. 19. Reprinted from ref. 9. Copyright (2018), with permission from Elsevier. (C) Model simulations for the evolution of cancer cell cooption around a blood vessel and the decrease in coopted vessel diameter were in agreement with experimental data in Fig. 2D (Color scale: low, 0; high = 18, dimensionless units). (D) Blood vessel cooption imaged using GFP tagged MGG8 cells and perfused blood vessels labeled with TAMRA-dextran. Images were created by high-resolution 3D reconstructions of intravital microscopy images of tumors from vehicle- and LGK974-treated MGG8-bearing mice (9). (Scale bar: 25 µm.) Reprinted by permission from ref. 19, Springer Nature: Nature Communications, copyright (2014). (E) Comparison of experimental data (squares, mean ± SEM) and model simulations (dash lines) for the number of MGG8 cancer cells in contact with the vessel wall. The y axis represents the ratio of the number of cancer cells during treatment divided by the number of cancer cells at day 0 for the experimental values and with the corresponding concentration of cancer cells in the model.

