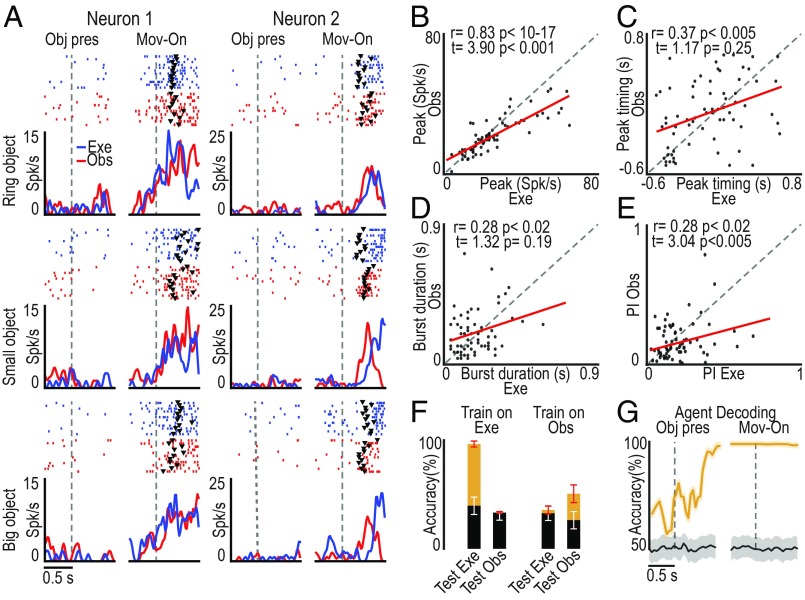
Fig. 3.
Relationship between the response of SOT action-related neurons (n = 69) during own-action execution and other’s action observation. (A) Single-neuron response (raster and line plot) during task execution (Exe, blue) and observation (Obs, red) with the three target objects. Alignments are as in Fig. 2. Black triangular markers indicate object-pulling onset. (B–E) Correlation plots of neurons’ peak of activity (B), peak timing (C), burst duration (Methods) (D), and object preference index (PI) (E) (Methods and SI Appendix, Fig. S4A) between action execution and observation (−0.5/+0.8-s interval relative to movement onset). Paired-sample t tests were performed to compare the values of each parameter between the tasks. (F) Object classification accuracy during execution and observation trials based on training a classifier with data collected during either one of the two tasks (orange, real data; black, shuffled data). Red and white error bars indicate 1 SD for real and shuffled data, respectively. (G) Time course of agent decoding accuracy during task execution and observation (orange line). Black line, chance level (Methods). Shaded area around the curves: ±1 SD over resample runs.

