Fig. 4.
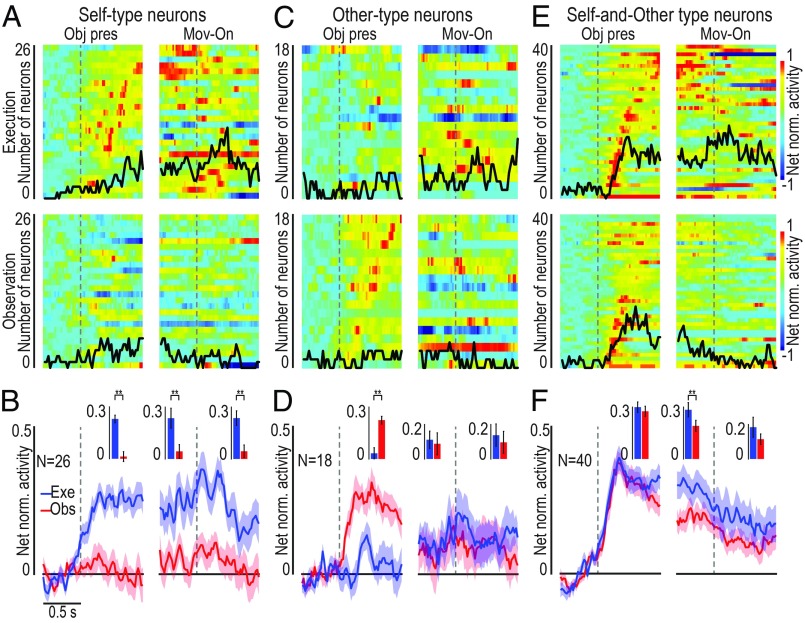
Single-neuron and population activity of self-type (ST), other-type (OT), and self- and other-type (SOT) object-related neurons. (A, C, and E) Heat map plots of the temporal activation profile of single-unit net normalized activity for ST (A), OT (C), and SOT (E) object-related neurons. Neurons are ordered based on the timing of their peak of activity in the object presentation period of the execution task, in case of ST and SOT neurons (A and E), or of the observation task, in the case of OT neurons (C), with the earliest on the Bottom for all plots. (B, D, and F) Time course and intensity of the mean net normalized population activity for the three sets of neurons shown in the correspondent panels above, during the execution (blue) and observation (red) task. All conventions are as in Fig. 2. Pired-samples t tests: **P < 0.01.

