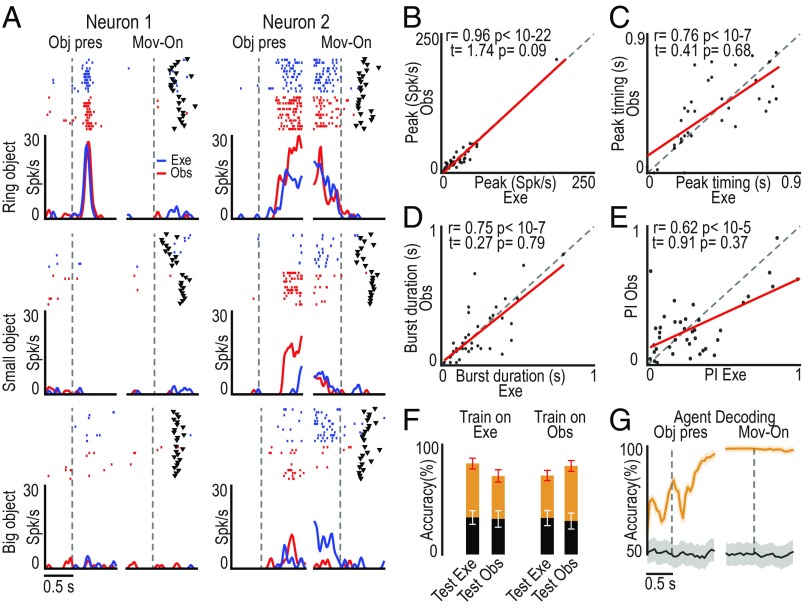
Fig. 5.
Relationship between the response of SOT object-related neurons (n = 40) to the visual presentation of the target for self (execution task) or other’s (observation task) action. (A) Single-neuron responses (raster and line plot) during task execution (Exe, blue) and observation (Obs, red) aligned (vertical dashed lines) on object presentation (Obj pres) and (after the gap) movement onset (Mov-on) with the three target objects. (B–E) Correlation plots calculated on the 0.8 s following object presentation in the execution and observation task of neurons peak of activity (B), peak activity timing (C), burst duration (D), and object PI (E) (SI Appendix, Fig. S4B). (F) Accuracy in the classification of the target during object presentation in execution and observation trials based on training a classifier with data collected during either one of the two tasks. (G) Time course of the agent decoding accuracy based on data collected during task execution and observation. All conventions are as in Fig. 3.

