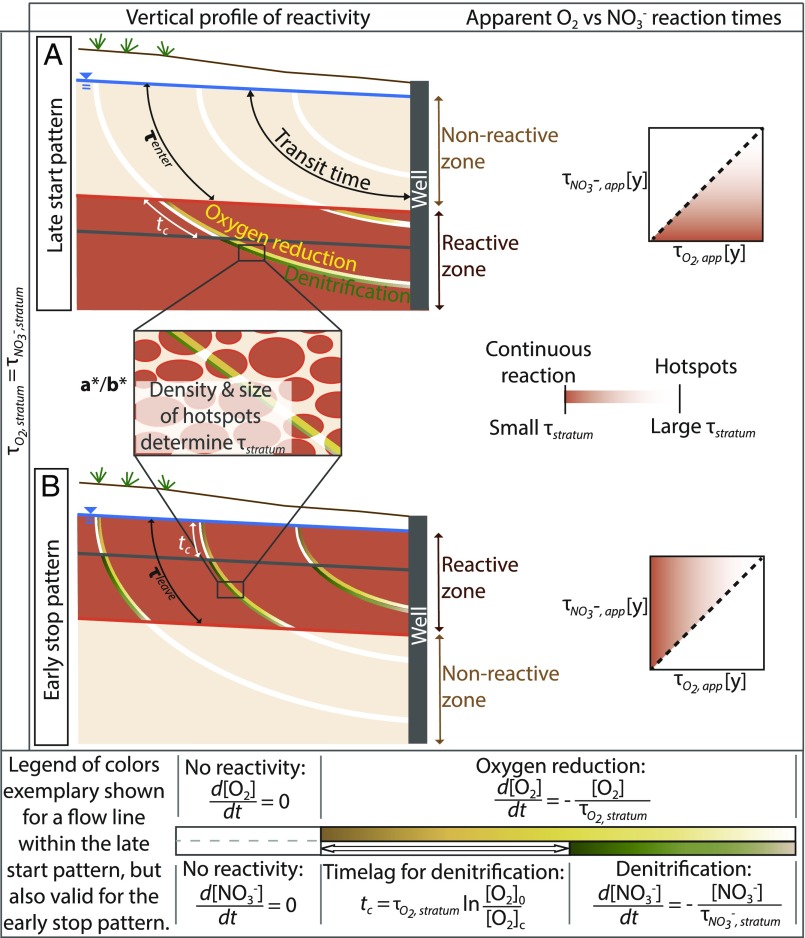
Fig. 1.
Schematic representation of the stratified reactivity framework. Potential vertical profiles of reactivity in an aquifer (Left) and resulting apparent reaction times (Right) are shown. The framework assumes similar stratum reaction times, τstratum, (within a given layer) for O2 and NO3−. A late start or an early stop of reactions along the flow paths results in differences in apparent O2 and NO3− reaction times. (A) Late start of reactivity creates the late start pattern, where the subsequent O2 and NO3− reduction only starts after a time, τenter, when the water reaches the reactive layer. The late start increases the apparent O2 reaction time compared with the stratum O2 reaction time. The subsequent apparent NO3− reduction is only marginally affected, because the time for NO3− reduction starts only after O2 is depleted, resulting in longer observed apparent O2 reaction times compared with NO3−. (B) Early stop of reactivity results in NO3− degradation first being limited by O2 and then by the absence of electron donors. In the early stop scenario, the apparent reaction time for O2 is smaller than for NO3−, and the difference between the two informs the characteristic time, τleave, when reactive elements leave the reactive stratum. Evenly distributed electron donors throughout the aquifer correspond to a small τenter and a large τleave and result in a uniform reactive stratum with a sequential reduction of O2 and NO3− starting at the water table. The relation of apparent O2 and NO3− reaction times in the case of a uniform reactive stratum is represented by the dashed line in the plot of apparent reaction times (also SI Appendix, section S2). The hot spot pattern is compatible with both stratified reactivity patterns (a*/b*).

