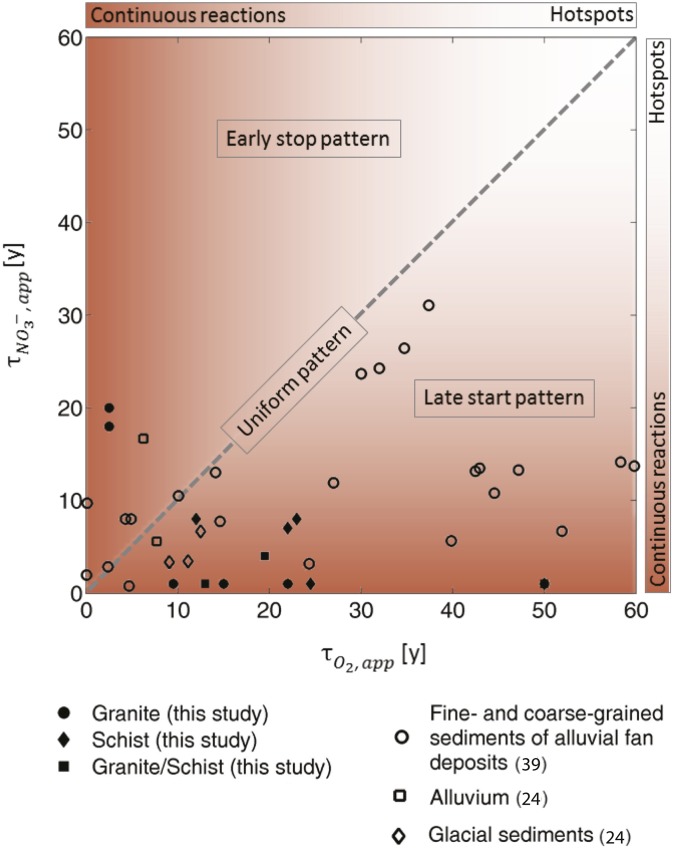
Fig. 3.
Apparent O2 versus apparent NO3− reaction times determined from field data for different aquifer types. The comparison provides information on the vertical pattern of reactivity (late start and early stop pattern) and related stratum reaction times. The dark brown color in the background indicates continuous reactions within the reactive stratum with short reaction times, and the light brown background indicates hot spots within the reactive stratum with larger reaction times depending on the density of hot spots (Materials and Methods and SI Appendix, section S2). The dominance of the late start pattern in aquifers is noticeable, with 79% of the data points indicating that reactions occur after a nonreactive time lag.

