Fig. 1.
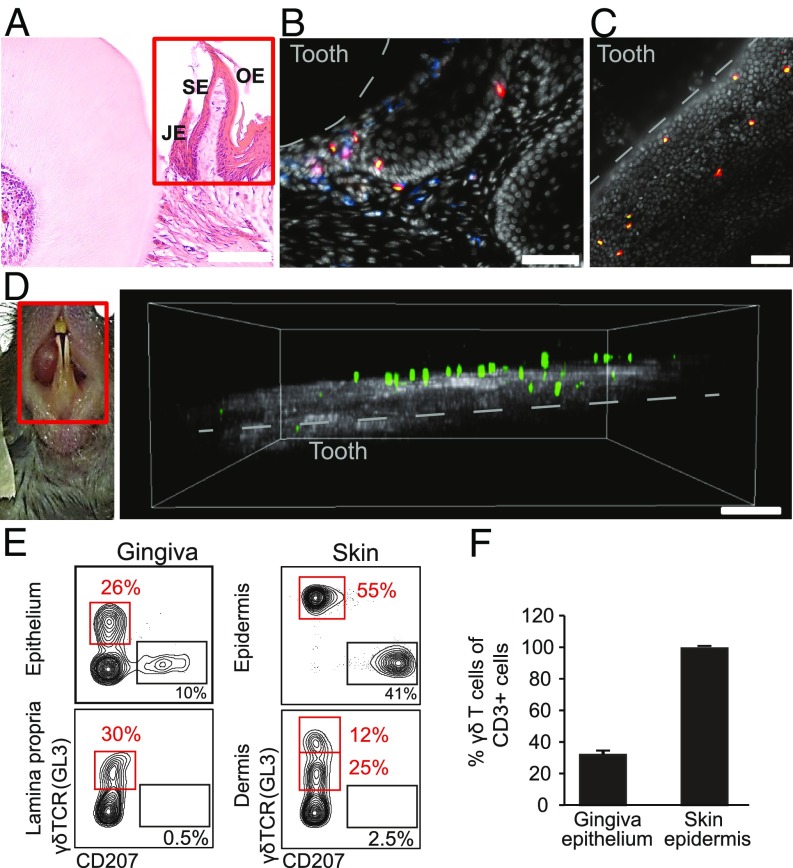
Visualization of γδT cells in the oral mucosa. (A) H&E histological staining of cross sections of the maxilla of adult TcrdH2BeGFP mice. The red rectangle specifies the gingival mucosa. JE, junctional epithelium; OE, oral epithelium; SE, sulcular epithelium. One representative of three independent analyses. (Scale bar, 100 µm.) (B) Immunofluorescence staining of cross sections of the maxilla of adult TcrdH2BeGFP mice (γδT cells in green/eGFP) with mAbs directed against CD45 (blue), CD3 (red), and with DAPI (white) for nuclear visualization. Representative image of four independent experiments. (Scale bar, 50 µm.) (C) Immunofluorescence whole mount staining from gingival epithelial layers of adult TcrdH2BeGFP mice with mAbs directed against CD3 (red) and with DAPI (white). Representative image from four independent experiments. Dotted white line indicates the location of the tooth surface. (Scale bar, 50 µm.) (D) Two-photon microscopy on gingival tissues of the lower incisors (Left; red rectangle indicates imaging area) of adult TcrdH2BeGFP mice demonstrating the localization of γδT cells (green/eGFP) close to collagen structures (gray) (Right). Representative of three independent experiments. (Scale bar, 70 μm.) (E and F) Epithelial and lamina propria/dermal layers were prepared from the gingiva or skin, and stained with antibodies against CD45, γδTCR, and langerin. (E) Representative FACS plots present the frequencies of γδT cells in each tissue. (F) Bar graphs depict percentages of γδT cells among total CD3+ cells in the gingiva and skin epithelium (n = 3). Data are representative of four independent experiments.

