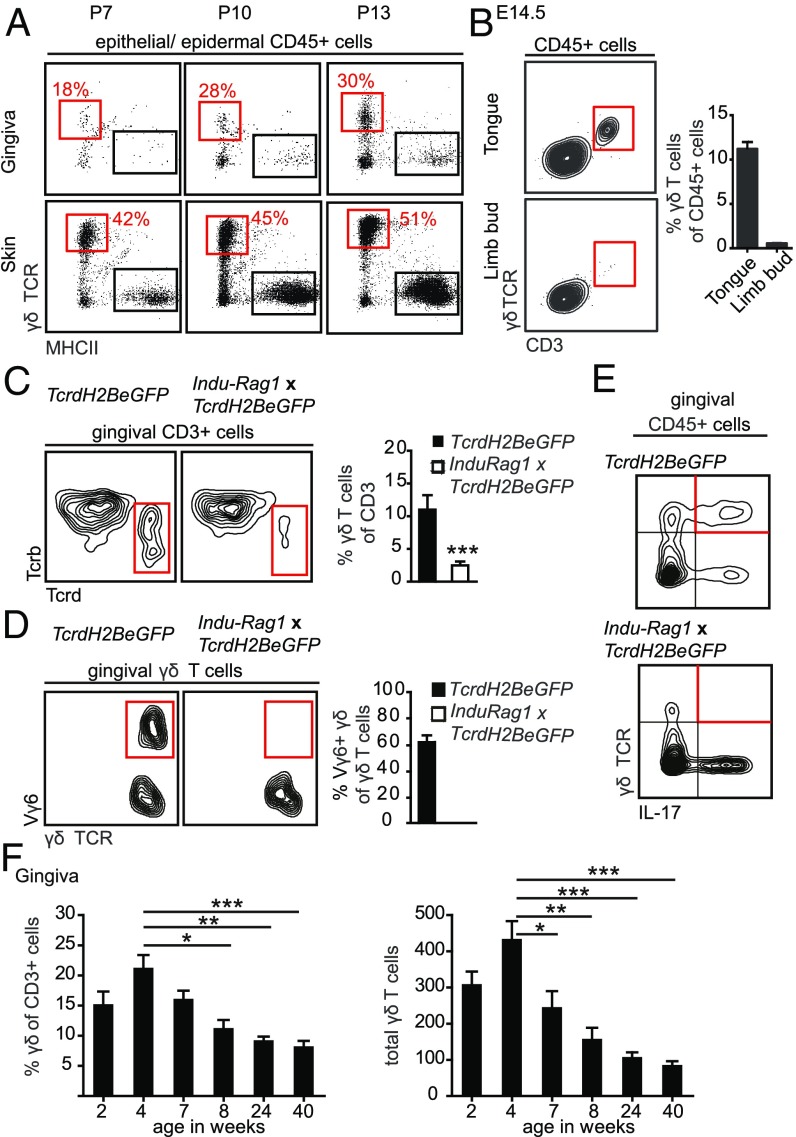
Fig. 3.
Oral γδT cells develop prenatally, expand postnatally, but decline with age. (A) FACS plots show frequencies of epithelial γδT cells in the gingiva and skin at indicated days postnatally (P). Five to six mice were analyzed in each experiment, two independent experiments. (B) Representative FACS plots and bar graph demonstrating the presence of γδT cells in the tongue and limb buds on day E14.5 (three independent experiments; eight embryos were analyzed in each experiment). (C) γδT cell populations among CD3+ cells in gingival tissues form TcrdH2BeGFP and Indu-Rag1×TcrdH2BeGFP adult mice. Representative FACS plots from three independent experiments. Bar graph depicts the mean frequencies + SEM of γδT cells among total gingival CD3+ T cells. (Data pooled from three independent experiments, n = 7–8 mice per experiment.) (D) Frequencies of Vγ6+ cells from total gingival γδT cells of TcrdH2BeGFP and Indu-Rag1×TcrdH2BeGFP mice. Bar graph demonstrates mean frequencies + SEM of Vγ6+ cells among total gingival γδT cells. Data were pooled from two independent experiments (n = 8 mice per experiment). (E) FACS plots show γδT cells producing IL-17 from total gingival leukocytes isolated from TcrdH2BeGFP and Indu-Rag1×TcrdH2BeGFP mice and stimulated ex vivo with PMA and ionomycin. (Three independent experiments, n = 8–10 mice per experiment.) (F) Frequencies and total numbers of murine gingival γδT cells throughout life. Data pooled from three independent experiments are shown and presented as the mean values + SEM (n = 6–9 mice per experiment). *P < 0.05, **P < 0.01, ***P < 0.001.

