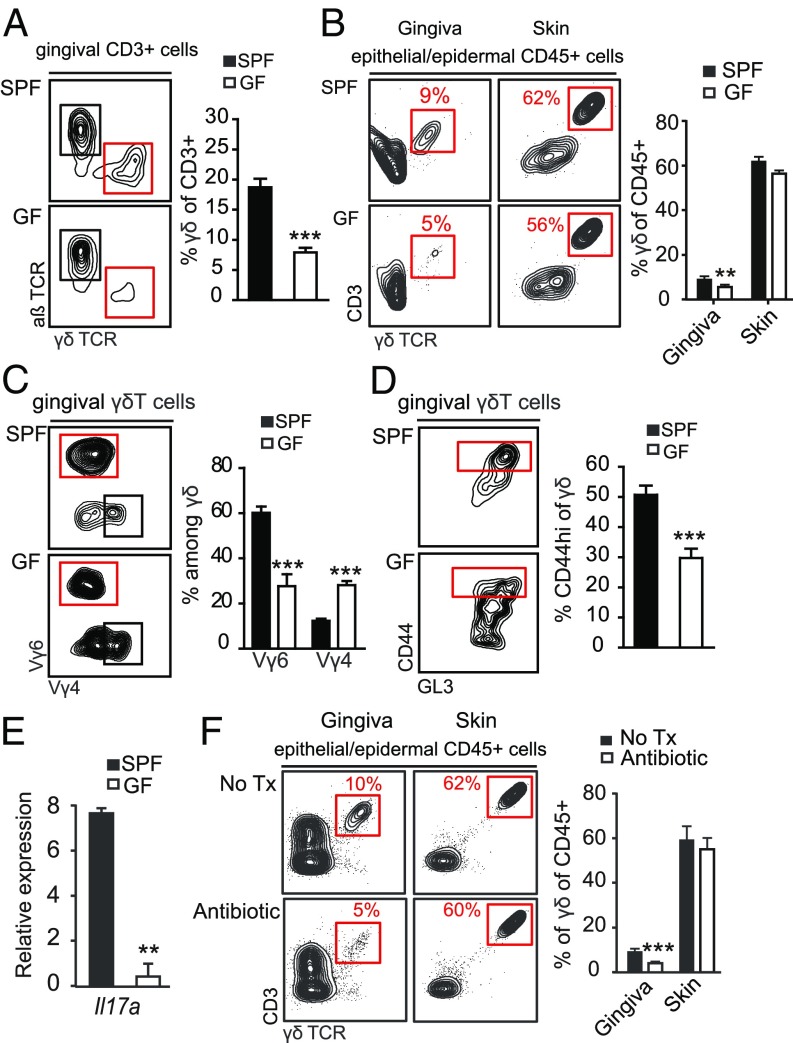
Fig. 5.
Commensal microbiota regulate the development and activation state of oral γδT cells. Gingival tissues were collected and processed from adult SPF and GF mice for flow cytometry analysis. (A) FACS plots and graphs depict the frequencies of γδT cells in the whole gingiva. Data are representative of four independent experiments. Bar graphs present the mean values + SEM of pooled data from four independent experiments (n = 7–10 mice per experiment). (B) Epithelial tissues were collected from the gingiva and skin of SPF and GF B6 mice. Representative FACS plots show the frequencies of γδT cells in each tissue. Bar graph presents the percentages of γδT cells among CD45+ cells as the mean values + SEM (n = 4 mice, three independent experiments). (C) Percentages of Vγ6+ and Vγ4+ γδT cells and (D) levels of CD44hi γδT cells in the gingiva of GF and SPF mice. FACS plots are representative of four independents experiments. Bar graphs present the mean values + SEM of pooled data from four independent experiments (n = 7–10 mice per experiment). (E) Expression of Il-17a mRNA in the gingiva of GF or SPF mice. Results of one of two independent experiments are shown as the mean values + SEM (n = 5 mice per group). (F) Adult SPF B6 mice were treated with a broad-spectrum antibiotic mixture in the drinking water for 2 mo. Representative FACS plots and graph demonstrate the percentages of γδT cells in gingival and ear skin epithelial tissues of antibiotic-treated mice and control group (n = 5). Results of two independent experiments are shown as the mean values + SEM. *P < 0.05, **P < 0.01, ***P < 0.001.

