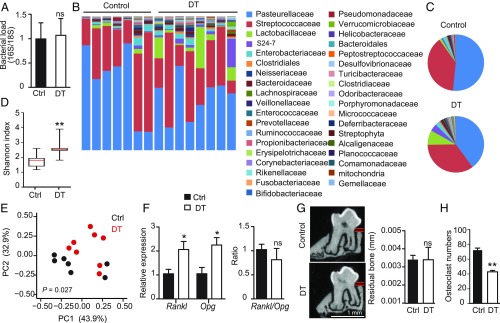
Fig. 7.
Ablation of γδT cells alters the relative diversity of oral microbiota. Adult Tcrd-GDL mice were injected intraperitoneally with DT on a weekly basis for 5 mo. (A) Total oral bacterial load was determined in oral swabs taken from the mice by qRT-PCR of the 16S rRNA gene. Bar graphs present the 16S/18S ratio in each group as the mean values + SEM (n = 7–8 per group). (B–E) Relative abundance of taxa in oral swabs sampled from DT-treated adult Tcrd-GDL mice and controls (Ctrl) upon prolonged DT treatment. Histograms represent the distribution of sequences in operational taxonomic units (OTUs) assigned to each class. Histograms for individual mice (B) as well as pie charts representing the mean distribution of OTU (C) are provided. (D) α-diversity plot representing taxa richness in samples of both groups of mice (rarified to 10,000 reads). Data represent the mean values + SEM (n = 7–8 mice per group). (E) Principal coordinates analysis of weighted UniFrac distances based on 16S rRNA of DT-treated mice versus littermate control. Taxonomic data from one of two independent experiments are shown. (F) Relative expression of Rankl and Opg as well as Rankl/Opg ratio in DT treated and control mice depicted as the mean values + SEM (n = 5). (G) Representative μCT sections of the second upper molar indicate the distance between the cementoenamel junction and alveolar bone crest. Graph demonstrates 3D quantification of the residual alveolar bone volume 5 mo after DT treatment presented as the mean values + SEM (n = 6–7 per group). (H) Osteoclast numbers identified as tartrate-resistant acid phosphatase-positive cells in gingival sections taken from DT and control groups 2 wk after the treatment. Representative bone loss data of two independent experiments are shown. *P < 0.05, **P < 0.01.

