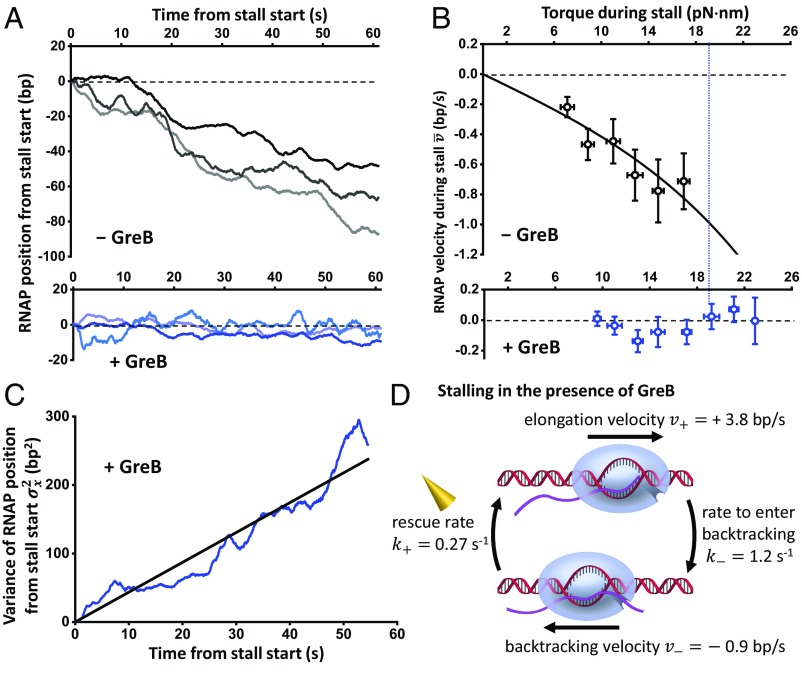
Fig. 3.
Kinetics of backtracking and GreB rescue. (A) Representative traces showing the RNAP position versus time after stalling in the absence (Top) and presence (Bottom) of GreB. For clarity, all traces are aligned with respect to the start of stall in both time and position. These traces have a torque ∼18 pN·nm upon stalling, close to the mean stall torque with GreB. (B) RNAP velocity versus torque during stall in the absence (Top) and presence (Bottom) of GreB. The error bars of torque are SD, and the error bars for RNAP velocity are SEMs. The black solid line is a fit to SI Appendix, Eq. S1, yielding a backtracking hopping rate in the absence of torque 0.26 s−1. The blue vertical dashed line indicates the mean stall torque in the presence of GreB (18.5 pN·nm). (C) Measured variance of RNAP position from the stall start versus time in the presence of GreB (blue). The black solid line is a linear fit passing through origin, yielding a slope of 4.4 bp2/s. (D) A two-state model of the RNAP during a stall in the presence of GreB (SI Appendix). We model the transitions between backtracking and elongation states as reversible first-order reactions.

