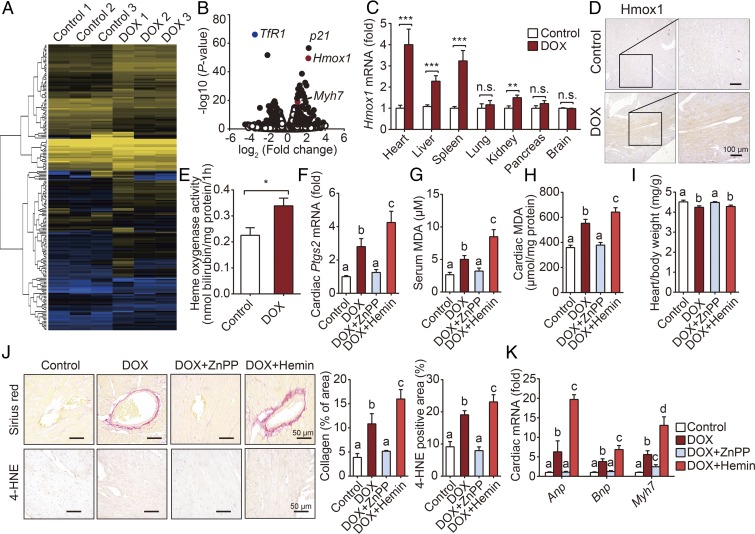
Fig. 3.
Hmox1 is essential for DOX-induced ferroptosis and cardiotoxicity. (A) Heat map showing differentially expressed genes in cardiac tissue between control and DOX-treated mice. Low expression is depicted in blue, and high expression is depicted in yellow. (B) Volcano plot showing the up-regulated and down-regulated genes in response to DOX treatment measured using RNA-seq analysis. Solid symbols indicate genes in which the differential expression was statistically significant. (C) Hmox1 mRNA was measured in the indicated organs of control and DOX-treated mice and is expressed relative to the respective control group (n = 8 mice per group). (D) Representative images of Hmox1-stained heart sections from control mice and DOX-treated mice. (E) Heme oxygenase activity was measured in heart homogenates obtained from control and DOX-treated mice (n = 6 mice per group). (F–H) Cardiac Ptgs2 mRNA (F), serum MDA (G), and cardiac MDA (H) levels were measured in control mice and mice treated with DOX with or without ZnPP or hemin (n = 6–7 mice per group). (I) Heart/body weight ratio was measured in control mice and mice treated with DOX with or without ZnPP or hemin (n = 6–7 mice per group). (J) Representative images (Left) and quantitative analyses (Right) of cardiac sections stained with Sirius red (to stain collagen; Top) and anti–4-HNE (Bottom) in control mice and mice treated with DOX with or without ZnPP or hemin. (K) Cardiac levels of Anp, Bnp, and Myh7 mRNA were measured in control mice and mice treated with DOX with or without ZnPP or hemin (n = 6–7 mice per group). Summary data are presented as the mean ± SEM. Significance in C and E was calculated using the Student’s t test; *P < 0.05; **P < 0.01; ***P < 0.001. Significance in F–K was calculated using a one-way ANOVA with Tukey’s post hoc test; groups labeled with different letters differed significantly (P < 0.05).

