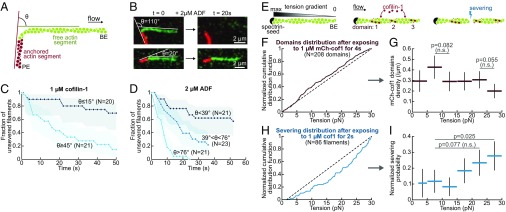
Fig. 3.
ADF/cofilin-induced severing is faster on bent filaments but barely affected by tension. (A) To assess the effect of curvature, a segment of biotin–F-actin is stabilized with rhodamine–phalloidin and left to bind the neutravidin–biotin-poly-L-lysine-PEG surface with a random orientation (red). A second segment, that does not bind the surface, is then polymerized from this seed with Alexa-488–actin (green). Only severing events taking place in the curved green region were considered. (B) Example of two filaments. The angle θ is defined as the angle between the flow direction and direction of the anchored segment. (C and D) ADF/cofilin-induced severing rate is significantly larger on curved filaments. The filament population was split into two or three subsets of equal size and different angle θ. The free filament segment (green) was on average 5.5 µm long (std 1 µm). The flow gradient was kept low (300/s), resulting in a tension of about 0.2 pN in the curved region. Shadows represent 95% confidence intervals (SI Appendix, Supplementary Methods and Information). We performed simple exponential fits to compare the severing rate between populations. (C) A 1 µM cofilin-1 solution was injected continuously from time t = 0. n = 20, 21 from low to high angles. We calculated a fivefold difference in the severing rate between the two populations. The two curves differ significantly (P = 0.0005, log-rank test). (D) A 2 µM ADF solution was injected continuously from time t = 0. n = 21, 23, 22 from low to high angles. We calculated a 10-fold difference in the severing rate between the two extreme populations, whose curves differ significantly (P < 0.0001, log-rank test). (E) Sketch of the experiment. The viscous drag of the fluid on a filament anchored by only one end generates a gradient of tension. (F and G) Distribution of cofilin domains along actin filaments exposed to 1 µM mCherry-cofilin-1 for 4 s. n = 208 domains over 30 filaments. <L> = 31 ± 5 µm. Flow gradient: 16,200/s. (F) Cumulative distribution of domains over the tension gradient. The distribution has been normalized to take into account the nonlinearity of the tension gradient and the differences in filament length (SI Appendix). The dashed line indicates a homogeneous distribution. (G) Density of cofilin domains on the different tension ranges. Red horizontal bars indicate the tension range. Black vertical bars indicate the 95% confidence interval (binomial confidence interval, SI Appendix). Statistical significance: Fisher’s exact test (SI Appendix). (H and I) Distribution of severing events along actin filaments exposed to 1 µM unlabeled cofilin-1 for 2 s. n = 86 filaments. <L> = 37 ± 7 µm. As it is difficult to distinguish severing events near the free BE from depolymerization, we excluded all events occurring in the first 5 pixels (<2 pN). (H) Cumulative distribution of severing events over the tension gradient. The distribution has been normalized to take into account the nonlinearity of the tension gradient (SI Appendix). Dashed line indicates a homogeneous distribution. (I) Effective probability for a severing event to occur in a tension range. Blue horizontal bars indicate the tension range. Black vertical bars indicate the 95% confidence interval (binomial confidence interval, SI Appendix). Statistical significance: one-sample binomial test (SI Appendix).

