Fig. 4.
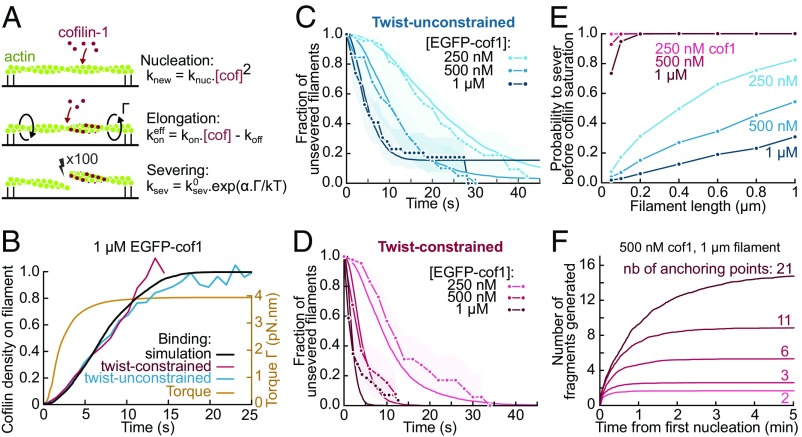
Model for the torque-induced enhancement of severing by cofilin. (A) Sketch and summary of the model used for simulations. (B) Computed cofilin density and resulting torque on twist-constrained filaments. The experimental curves for cofilin density (in red and blue) come from Fig. 2C. The maximum torque applied on twist-constrained filaments corresponds to an undertwist of ∼5 rotations per micrometer. (C and D) Fit of the fraction of unsevered filaments in free (C) and constrained twist (D) conditions. k0sev = 2.4 × 10⁻² s−1 was determined by fitting the data at 1 µM cofilin with unconstrained twist, and α = 5 was then determined by fitting the data at 1 µM cofilin with constrained twist. All other curves were simulated using these same parameters, with no further adjustment. The experimental curves are from Fig. 2D. Simulations were performed over 50-fold larger samples of filaments with the same lengths. Shadows represent 95% confidence intervals (SI Appendix, Supplementary Methods and Information). (E) Probability for a filament to sever before being saturated by cofilin-1 depending on its length and cofilin concentration, when twist is free (blue curves) or constrained (red curves). Each probability was computed by simulating 1,000 filaments. (F) Simulated number of actin fragments generated by cofilin, on filaments anchored by at least their two ends plus additional points, randomly positioned along their length. Each curve shows the mean over 100 simulations. The curves reach a plateau when the filament is saturated by cofilin.

