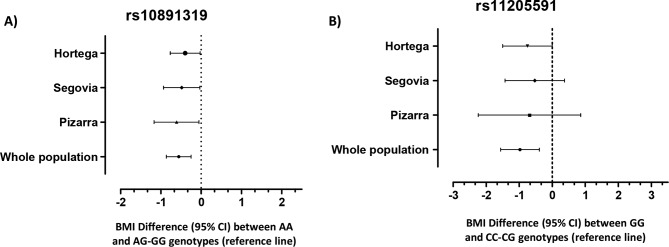
Figure 1.
Body mass index (BMI) differences found for the associated single nucleotide polymorphism (SNPs) genotypes for each population analysed in this study. Values are expressed as BMI difference means, showing 95% CI. (A) rs10891319 BMI differences between AG-GG and AA genotypes, taking the first one (BMI difference=0 for carriers of AG-GG genotype) as reference. (B) rs11205591 BMI differences for CC-CG and GG genotypes, with the first one as a reference (CC-CG genotype BMI difference=0).

