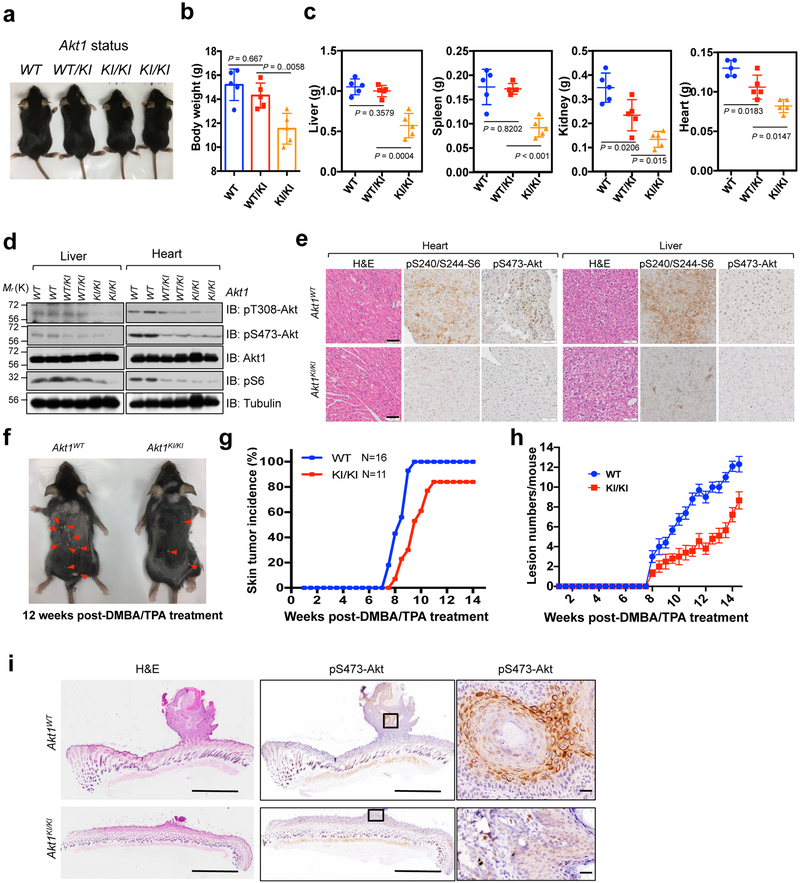
Fig. 2. Methylation deficient Akt1 knock-in mice display reduced body size/weight and resist to chemical carcinogen-induced skin tumorigenesis in vivo.
a, Mice derived from the same litter were imaged at age of 4 weeks old. b, The mice derived from the age of 4 weeks were weighed (including 15 male mice with 5 WT, 5 heterogeneous, and 5 homogeneous-Akt1K140/142R genetic background status). Error bars are mean ± s.e.m, n = 5 mice. P values were calculated using two-tailed unpaired Student’s t test. c, The mice in (b) were euthanized and their organs were dissected and weighed. Error bars are mean ± s.e.m, n = 5 mice. P values were calculated using two-tailed unpaired Student’s t test. d, IB analysis of WCL derived from livers or hearts of WT (+/+), Akt1K140/142R-knock-in heterogeneous (+/KI) or homogeneous (KI/KI) mice from the same litter at age of 4 weeks. The experiment was performed twice, independently, with similar results. e, Graphic representation of H&E and IHC staining of heart and liver tissues derived from WT or Akt1K140/142R-KI mice. Scale bar, 50 μm. This experiment was performed twice, independently, with similar results. f, The side view of 12-weeks old mice derived from WT or Akt1K140/142R knock-in mice were treated with chemical carcinogen (DMBA following with TPA) (n = 16 for WT mice; n = 11 for Akt1-K140/142-KI mice). The neoplasm lesions were arrowed. The tumor incidence (g) and lesion numbers (h) of the mice described in (f) were calculated and plotted. Error bars are mean ± s.e.m (for WT n = 16 mice; for Akt1-K140/142-KI n=11 mice). After treatment 12 weeks with DMBA/TPA, the mice were euthanized and the H&E and IHC staining were performed (i). Scale bar, 1 mm. The experiment in (i) was performed twice, independently, with similar results. Statistical source data for b,c,g and h are shown in Supplementary Table 2. Scanned images of unprocessed blots are shown in Supplementary Fig. 8.

