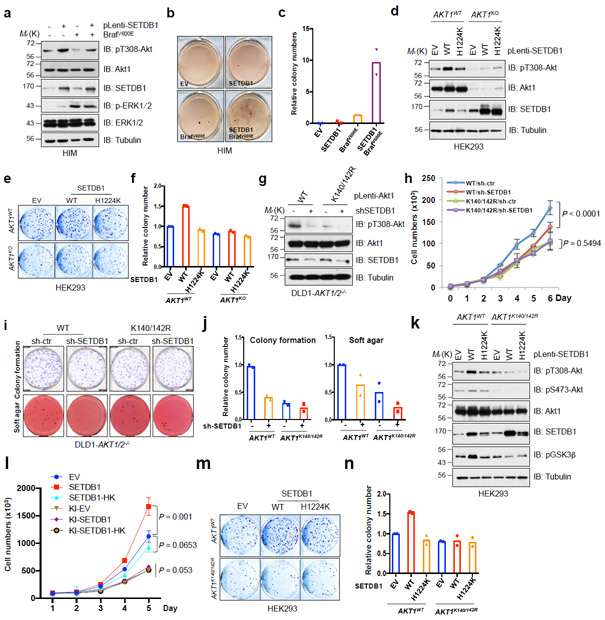
Fig. 4. Oncogenic function of SETDB1 depends on the activation of Akt.
a-c, Human immortalized melanocytes (HIM) were lentivirally infected with indicated constructs, and selected with puromycin and hygromycin for 72 hrs before harvesting for IB analysis (a). Resulting cells were subjected to soft agar assays (b). d, IB analysis of CRISPR/CAS9-mediated AKT1 knockout and parental HEK293 cells which were lentivirally infected with the constructs encoding SETDB1. e,f, Cells described in d were subjected to colony formation assays (e). g-j, DLD1-AKT1/2−/− cells were infected with virus encoding WT or mutated Akt1, and selected with hygromycin for 72 hrs. Resulting cells were lentivirally infected with shRNA against SETDB1 (with shCtr as a negative control) and selected with puromycin for 72 hrs, and were harvested for IB analysis (g), cell proliferation (h), colony formation and soft agar (i) assays. k-n, AKT1 K140/142R-edited and parental HEK293 cells were lentivirally infected with SETDB1-WT or SETDB1-H1224K encoding constructs and selected with puromycin for 72 hrs before harvesting for IB analysis (k). Resulting cells were subjected to proliferation (l) and colony formation (m) assays. The experiments in (b,e,i,m) were performed twice independently with three repeats, and exhibited similar results. Relative colony numbers derived from two independent experiments were plotted in (c,f,j,n). The cell proliferation assays in (h,l) were performed three times independently, and cell numbers were quantified in (h,l). Error bars are mean ± s.e.m, n = 3 independent experiments. Two-way ANOVA analysis was performed in (h,l) to calculate the P value. Detailed statistical tests are described in the Methods. Source data for c,f,h,j,l and n are shown in Supplementary Table 2. Western-blots in (a,g,k) were performed twice, independently, with similar results. Scanned images of unprocessed blots are shown in Supplementary Fig. 8.

