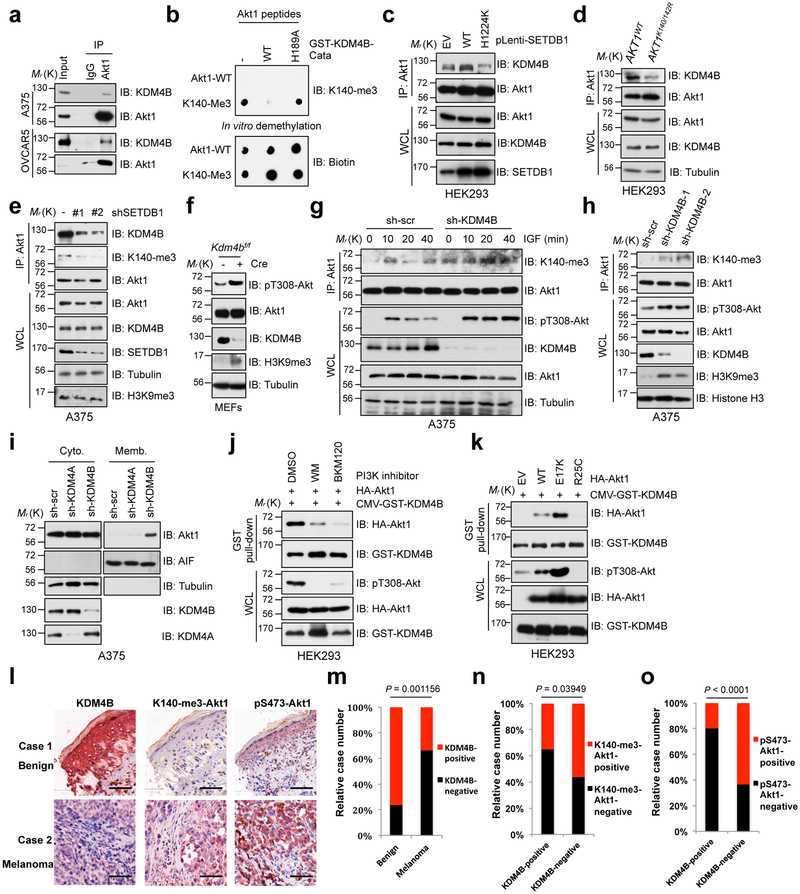
Fig. 6. KMD4B demethylates Akt to inhibit Akt kinase activity.
a,c-e, IB analysis of Akt1-IP products and WCL derived from A375, OVACR5 cells (a), SETDB1 expressing HEK293 cells (c), AKT1K140/142R-edited and parental HEK293 cells (d) and SETDB1-depleted A375 cells (e). IgG was used as a negative control. b, IB analysis of in vitro de-methylation assays performed with synthetic Akt1-K140-me3 peptides as substrate, and bacterially purified catalytic domain of KDM4B as the source of demethylase. f, IB analysis of WCL derived from primary Kdm4b conditional knockout MEFs infected with or without phage-Cre for 48 hrs before harvesting. g, A375 cells were lentivirally infected with shRNA against KDM4B. Resulting cells were serum starved for 20 hrs, then stimulated with IGF (100 ng/ml) before harvesting for IP and IB analysis. h, IB analysis of IP products and WCL derived from A375 cells infected with lentivirus against KDM4B. i, IB analysis of cell fractionations separated from A375 cells lentivirally infected with shRNA against KDM4B or KDM4A. j,k, HEK293 cells were transfected with indicated constructs and treated with different PI3K inhibitors for 1 hr (j) before subjected to GST pull-down assay and IB analysis. l-o, IHC staining of KDM4B, pS473-Akt1 and K140-me3-Akt1 in melanoma TMA (l). Scale bar, 50 μm. The distribution of KDM4B staining was plotted in (m, n = 97 tissue specimens). The correlations of pS473-Akt or K140-me3-Akt1 with KDM4B were plotted in (n, n = 96 tissue specimens; o, n = 95 tissue specimens). All P values were calculated using Chi-Square test. Detailed statistical tests were described in Methods. Western-blots were performed twice, independently, with similar results. Statistical source data for m-n are shown in Supplementary Table 2. Scanned images of unprocessed blots are shown in Supplementary Fig. 8.

