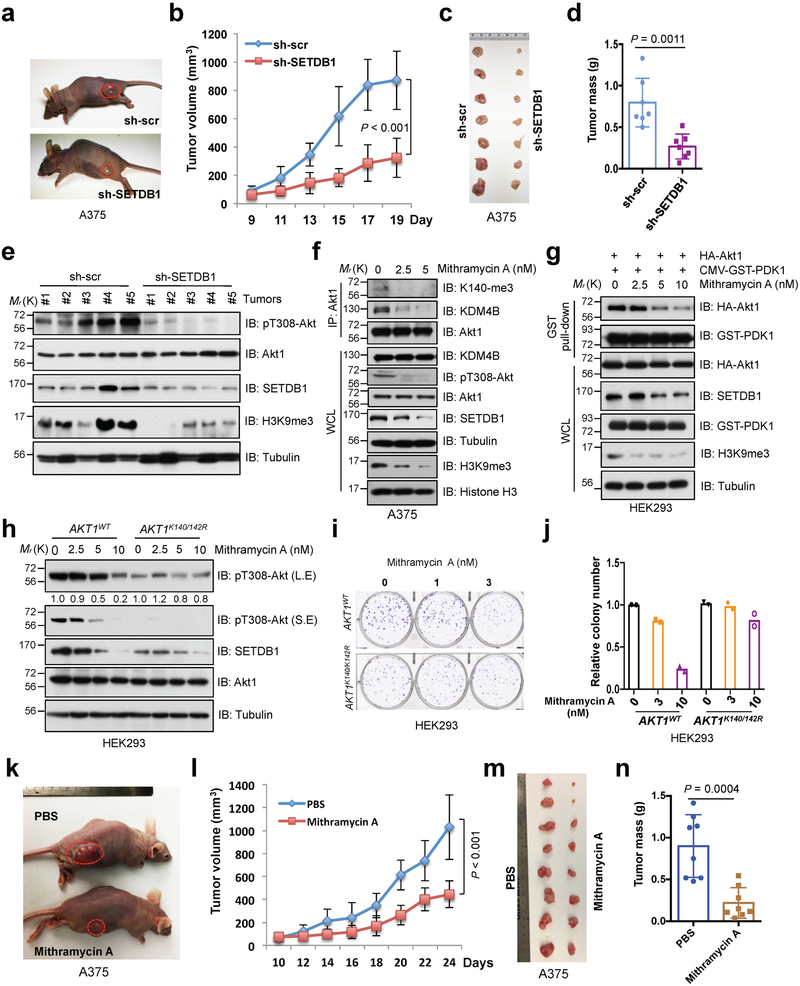
Fig. 7. Deficiency of SETDB1 inhibits Akt kinase activity and oncogenic function.
a-d, SETDB1-depleted A375 and control cells were subjected to mouse xenograft assays. Tumor sizes were monitored (a,b). Tumors were dissected (c) and tumor mass were weighed (d). Error bars are mean ± s.e.m, n = 7 mice. P values were calculated by using two-way ANOVA analysis (b) and two-tailed unpaired Student’s t test (d). e, The phosphorylation status of Akt1 (pT308-Akt) and methylation of H3K9 (H3K9me3) were detected by IB analysis with WCL derived from recovered xenografted tumors. f, IB analysis of IP products and WCL derived from A375 cells treated with different doses of Mithramycin A for 72 hrs before harvesting. g, HEK293 cells were transfected with indicated constructs and treated with different doses of Mithramycin A for 72 hrs before harvesting for GST pull-down assays and IB analysis. h-j, AKT1K140/142R-edited and parental HEK293 cells were treated with different doses of Mithramycin A for 72 hrs and subjected to IB analysis (h). Meantime, resulting cells were subjected to colony formation (i) assay. The experiment was performed twice independently with three repeats, and exhibited similar results (i). Representative images were shown in (i) and relative colony numbers derived from two independent experiments were plotted in (j). k-n, Mithramycin A treatment reduced in vivo tumorigenesis of xenografted A375 cells. When the tumors of xenografted A375 cells reached 100 mm3, the mice were treated with Mithramycin A (0.2 mg/kg) or PBS (as a negative control). Tumor sizes were monitored in (k,l) and tumor mass were weighed and presented in (m,n). Error bars are mean ± s.e.m, n = 8 mice. P values were calculated by using two-way ANOVA analysis (l) and two-tailed unpaired Student’s t test (n). Detailed statistical tests are described in the Methods. Source data for b, d, j, l and n are shown in Supplementary Table 2. Scanned images of unprocessed blots are shown in Supplementary Fig. 8.

