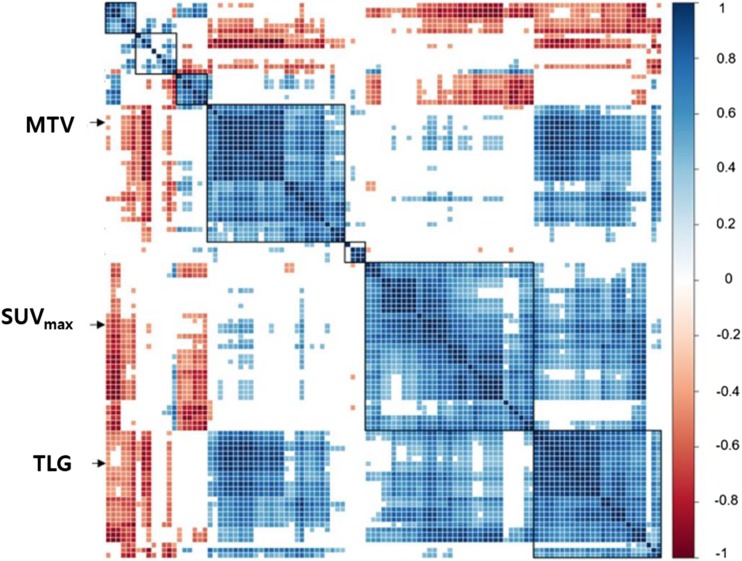
Fig. 4.
Dependence on SUVmax and MTV of AQ-based texture features. The correlogram of 109 texture features shows dependence on conventional PET parameters, including SUVmax and MTV (p < 0.0005). AQ absolute quantization, MTV metabolic tumor volume, SUVmax maximum standardized uptake value, TLG total lesion glycolysis. Note: Color bar, Pearson correlation coefficient. Modified from Ha (2017) [47], which is licensed under a Creative Commons Attribution 4.0 International License (http://creativecommons.org/licenses/by/4.0/)

