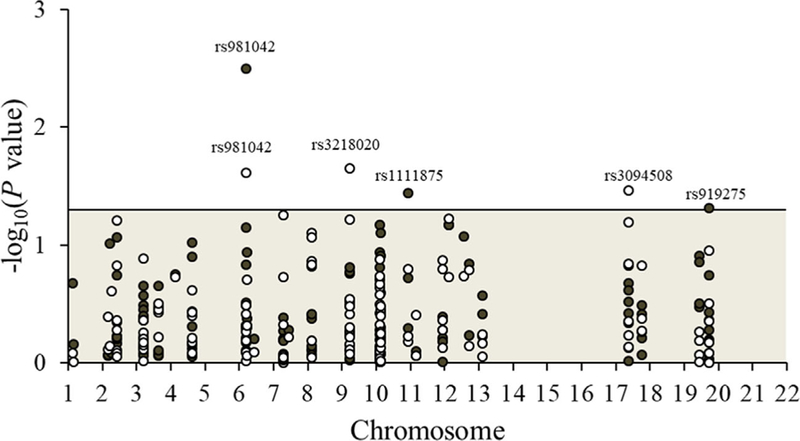
FIGURE 2.

Manhattan plot showing the significance of additive association between all 143 diabetes-related SNPs and all-cause (black circles) and breast cancer-specific (white circles) mortality among 817 women with invasive breast cancer in the Long Island Breast Cancer Study Project. The six SNPs that reached significance at alpha of 0.05 (those above the horizontal line) are listed in Table 3. [Color figure can be viewed at wileyonlinelibrary.com]
