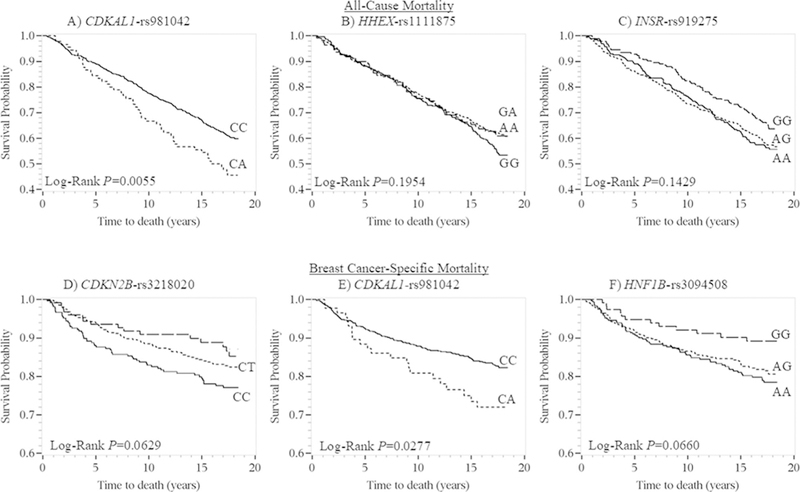
FIGURE 3.
Kaplan-Meier survival plots for all-cause for (A) CDKAL1-rs981042, (B) HHEX-rs1111875, and (C) INSR-rs919275; and breast cancer-specific mortality for (D) CDKN2B-rs3218020, (E) CDKAL1-rs981042, and (F) HNF1B-rs3094508 stratified by genotype among LIBCSP women diagnosed with invasive breast cancer in 1996–1997 (n = 817). The x-axis shows times to death in years; the y-axis shows proportion of participants alive

