Fig. 3.
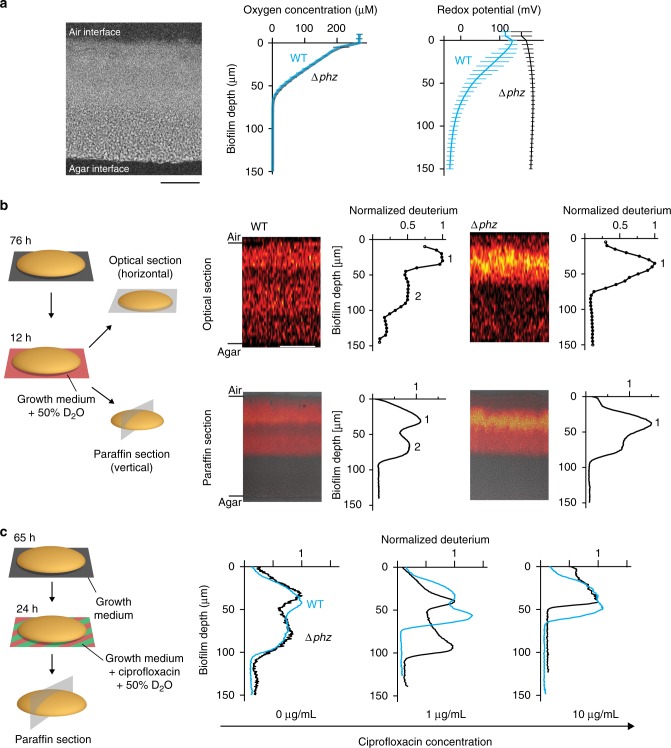
The distribution of metabolic activity in biofilms is influenced by phenazine production and exposure to ciprofloxacin. a Left: Section of a WT colony biofilm, prepared by paraffin embedding, stained with DAPI, and visualized by fluorescence microscopy. Scale bar is 50 µm. Data from sectioning experiments were collected at the approximate center of the colony in an area of 254 × 254 µm. Center and right: Microsensor and microelectrode profiling show that oxygen concentration is depleted at ~70 µm in WT (blue) and ∆phz (black) biofilms (center) and that phenazines are reduced at depth in WT biofilms (right). Data show mean and standard deviation for biological replicates for oxygen (WT: N = 7, ∆phz: N = 8) and for redox (WT: N = 8, ∆phz: N = 3) microprofiling. b Left: Schematic of experimental design used to visualize metabolic activity in colony biofilms by stable isotope labeling. Spatially resolved readouts were acquired by either collecting images in 5 µm steps in z-direction in an area of 254 × 254 µm over the biofilm depth (optical sectioning) or by subjecting biofilms to paraffin embedding and sectioning, followed by imaging signal in a 10-µm-thin slice of the colony (paraffin sectioning). Right: Images and plotted deuterium signals obtained for optical and paraffin sections of colony biofilms after a 12-h incubation on D2O-containing medium. Data plots show mean deuterium signal per biofilm depth. One replicate each of WT and ∆phz is shown and is representative of at least five biological replicates. For data of all replicates, see Supplementary Figure 8a. Deuterium signals are normalized to the signal in peak 1 within each sample. Scale bar is 50 µm. Paraffin section images are overlaid with protein signal to outline the colony. c Left: Schematic of experimental design used to visualize metabolic activity after incubation on labeled medium containing ciprofloxacin. Right: Deuterium signal for one biological replicate each of WT (blue) and ∆phz (black) after a 24 h incubation on medium containing D2O and 0, 1, or 10 µg/ml ciprofloxacin. Deuterium signals are normalized to the signal in peak 1 within each sample. Data plots show mean deuterium signal per biofilm depth. For data of all replicates (N = 3), see Supplementary Figure 8b

