Fig. 6.
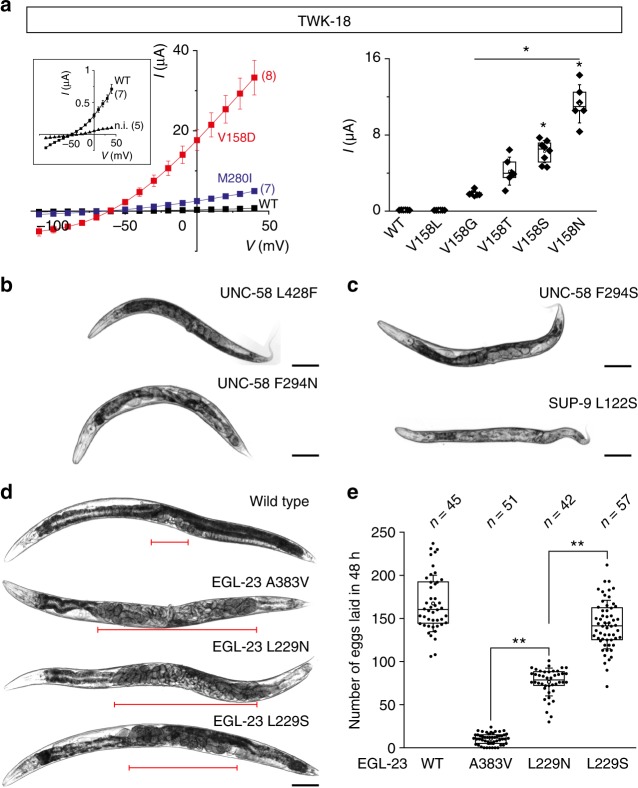
Tuning K2P channel activity in vivo using CRISPR/Cas9 gene editing in C. elegans. a (left panel) Current–voltage relationships obtained at pH 7.4 in X. laevis oocytes for TWK-18 wild-type (black squares), TWK-18 M260I (blue squares), and TWK-18 V158D mutant channels (red squares). Inset, current–voltage relationship for wild-type channel and non-injected oocytes at a reduced scale. a (right panel) Gradual increase of TWK-18 whole-cell current in a series of TM2.6 mutants. Currents at 0 mV were recorded 24 h after injection of cRNA at 30 ng/oocyte. Each data point represents one oocyte. b Representative micrographs of 1-day old adult UNC-58 L428F, UNC-58 F294N, UNC-58 F294S, c SUP-9 L122S, and d wild type, EGL-23 A383V, EGL-23 L229N, and EGL-23 L229S worms. Red brackets mark the central section of each animal where embryos accumulate. Scale bars, 10 µm. e Comparison of egg-laying rates of wild-type worms and egl-23 gain-of-function alleles. Each data point represents the number of embryos laid by a single animal over a 48-h period. n, number of animals tested. Center lines, medians; open circles, means; box limits, 25th and 75th percentiles; whiskers, standard deviation. Kruskal–Wallis, Dunn’s multiple comparison test, *p < 0.01

