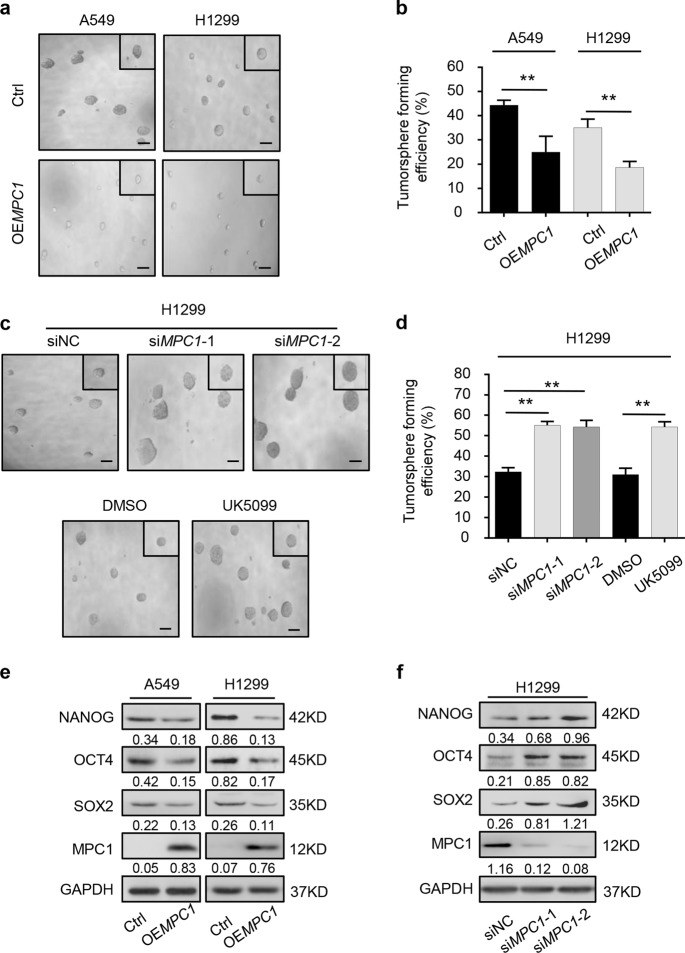
Fig. 2. MPC1 deficiency promotes the stem-like traits of LAC cells.
a, b The representative images (a) and numbers (b) of tumorsphere in OEMPC1 cells and Ctrl cells by tumorsphere formation assay, scale bar = 100 µm. c, d The representative images (c) and numbers (d) of tumorsphere in siMPC1 and siNC LAC cells, and cells treated with DMSO or UK5099 (40 μM) by tumorsphere formation assay, scale bar = 100 µm. e, f Western blotting analysis of the abundances of NANOG, OCT4, and SOX2 in up- (e) and downregulated (f) MPC1 groups as compared with control groups. Data are expressed as the mean ± SD, **P<0.01

