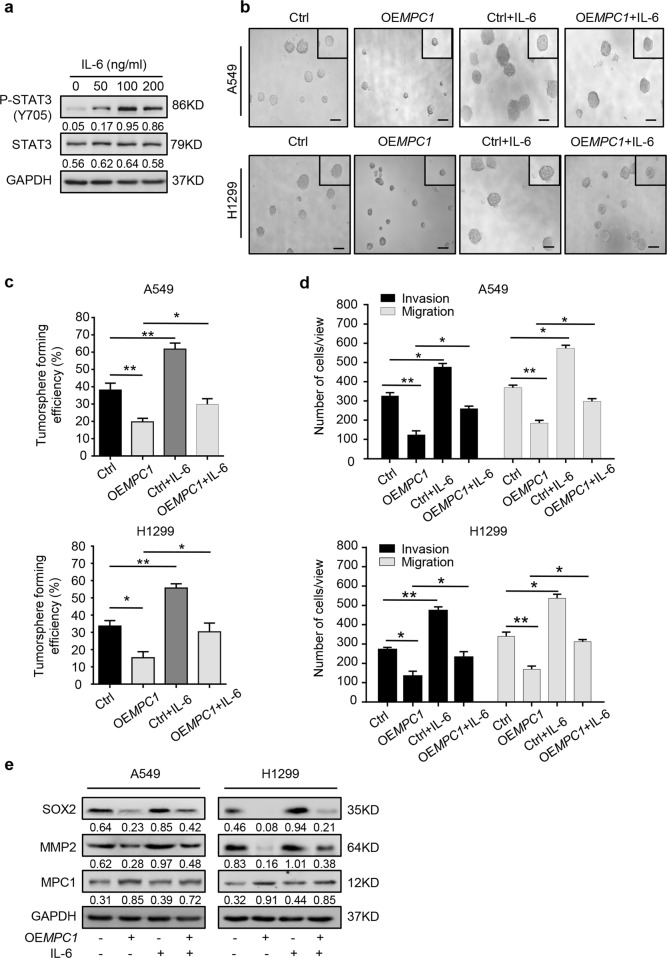
Fig. 5. MPC1/STAT3 axis regulates the progression of LAC cells.
a Western blotting showing the protein expression levels of STAT3 and P-STAT3(Y705) in A549 cells treated with IL-6 for 24 h at the indicated dose. b, c The representative images (b) and numbers (c) of tumorspheres from the Ctrl and OEMPC1 A549 and H1299 cells treated with or without IL-6 (100 ng/ml). Scale bar = 100 µm. d The number of motile Ctrl and OEMPC1 A549 and H1299 cells treated with or without IL-6 (100 ng/ml). e Western blotting showing the expression of SOX2, MMP2, and MPC1 in Ctrl or OEMPC1 A549 and H1299 cells treated with or without IL-6 (100 ng/ml). Data are expressed as the mean ± SD, *P<0.05, **P<0.01

