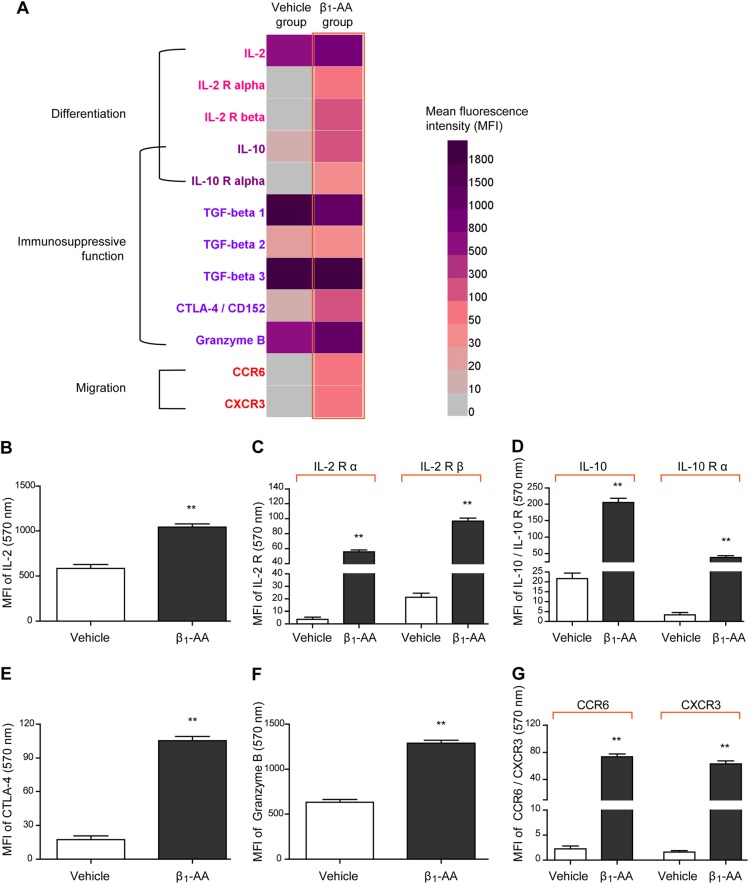
Fig. 1. Expressions of nTreg cell-related proteins and cytokines in β1-AA positive mice.
a Heat map of cluster analysis for expressions of nTreg cell-related proteins in β1-AA-positive mice at the eighth week after β1-AR mAb administration. Dark purple and light gray represented high and low levels of expression for the indicated proteins, respectively. All cytokines and cytokine receptors were detected by protein microarray chip analysis. b–g The quantitative levels of serum IL-2 (b), IL-2 receptor (c), IL-10/IL-10 receptor (d), CTLA-4 (e), granzyme B (f), and CXCR3 and CCR6 (g) in the sera of the model mice. Data are presented as means ± SD (n = 3 per group). **P < 0.01 vs. vehicle group

