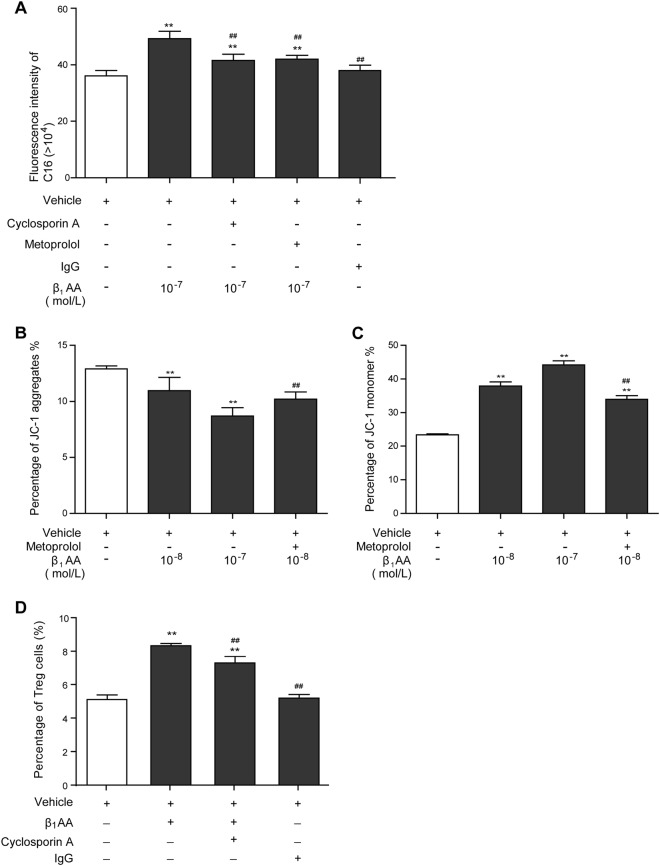
Fig. 6. Effect of mitochondrial membrane potential (MMP) on β1-AA-induced nTreg cell differentiation.
a The absorption level of palmitate in activated CD4+ T cells after β1-AA stimulation with or without cyclosporin A. b, c Percentages of JC-1 aggregate and JC-1 monomer in activated CD4+ T cells after β1-AA stimulation. d Percentage of nTreg cells in activated CD4+ T cells after β1-AA stimulation with or without cyclosporin A. Data are presented as means ± SD (n = 5 per group). **P < 0.01 vs. vehicle group; ##P < 0.01 vs. β1-AA group

