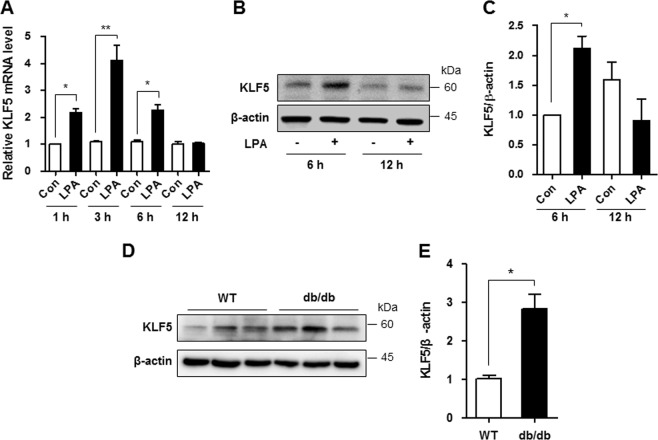
Fig. 3. LPA upregulates KLF5 expression in SV40 MES13 cells.
a The expression of the KLF5 mRNA at 1, 3, 6, or 12 h in cells treated with 10 μM LPA was analyzed using qRT-PCR (n = 3 independent experiments). b Western blots showing KLF5 and β-actin levels at 6 or 12 h after treatment with 10 μM LPA. c The relative level of KLF5 was normalized to β-actin and quantified using ImageJ software. d Western blot showing the level of the KLF5 protein in the renal cortex of 9-week-old wild-type (WT) and db/db mice. e The results were quantified, and β-actin was used as a loading control (n = 3–4). *p < 0.05, **p < 0.01. Data are presented as means ± SEM

