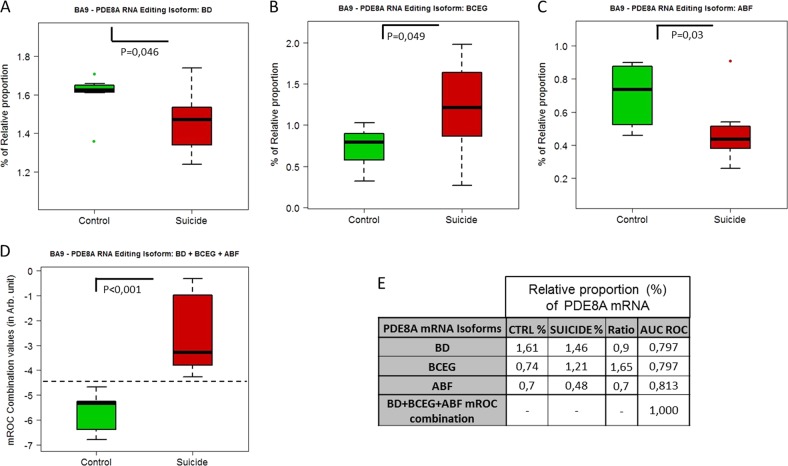
Fig. 6. Suicide-induced alterations of the relative proportion of PDE8A isoforms in BA9.
a–c Comparison of the relative proportion of BD, BCEG and ABF isoforms in control (n = 8) and suicide groups (n = 8). Boxplot represents the distribution of the relative proportion of PDE8A mRNA in BA9 of both groups. d Boxplot representation of mROC combination of relative proportions (%) of BD + BCEG + ABF PDE8A isoforms in BA9 of both groups. e Table showing the most significant changes of the relative proportion of PDE8A mRNA isoforms in BA9 of both groups. The symbol * indicates, for Wilcoxon rank-sum test, a p-value ≤ 0.05, ** indicate a p-value ≤ 0.01 and *** indicate a p-value ≤ 0.001

