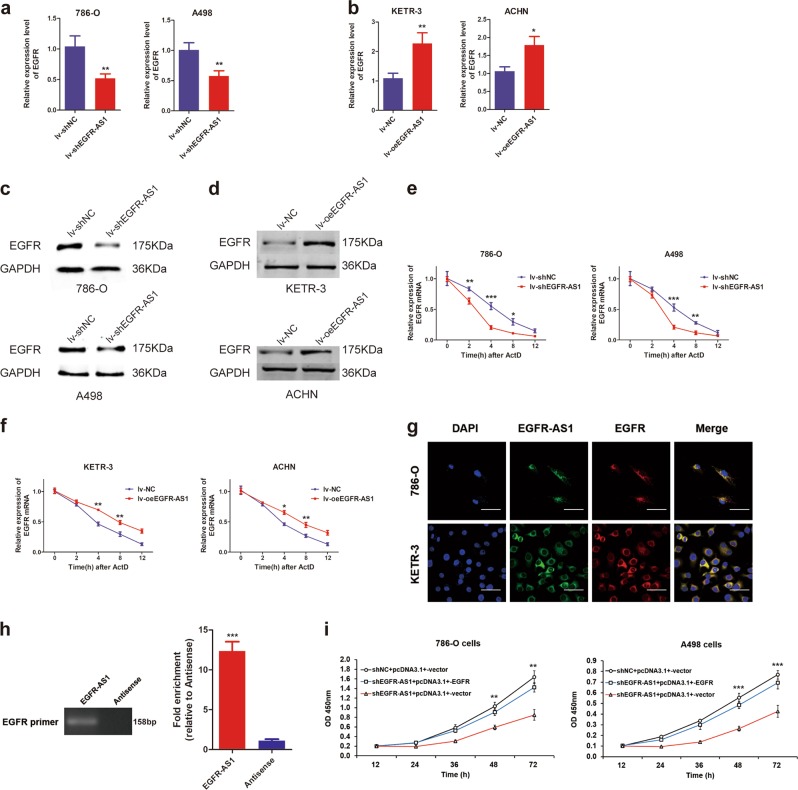
Fig. 4. EGFR-AS1 promotes proliferation and migration in RCC cells by upregulating EGFR expression.
a Relative expression of EGFR at the mRNA level between the lv-shNC and Lv-shEGFR-AS1 RCC cell lines. b Relative expression of EGFR at the mRNA level between the lv-NC and lv-oeEGFR-AS1 RCC cell lines. c Western blot analysis of EGFR protein expression between the EGFR-AS1 knockdown and control group. GAPDH was used as the internal control. d Western blot analysis of EGFR protein expression between the EGFR-AS1 overexpression and control group. e, f RNA stability assays were performed in RCC cell lines using Actinomycin D to disrupt RNA synthesis, and the degradation rate of the EGFR mRNA was measured and calculated over 12 h. EGFR mRNA levels were measured in the EGFR-AS1 knockdown (e) or overexpression (f) group and the NC group. g RNA FISH analysis of EGFR-AS1 (green) and EGFR mRNA (red) in 786-O and KETR-3 cells. The rightmost graph shows the colocalization of signals between the red signal (EGFR-AS1) and the green signal (EGFR). Pearson’s R = 0.696. Scale bar = 50 μm. h Agarose gel electrophoresis experiments of enriched product from the EGFR-AS1 RNA pull-down experiment in 786-O cells. EGFR-AS1 pull-down products were purified to obtain total conjugated RNA using RNA purification step in the RIP experiment. The antisense of EGFR-AS1 served as an internal control. i CCK-8 assay of EGFR-AS1 knockdown and control cells transfected with pcDNA3.1+-EGFR at the indicated times

