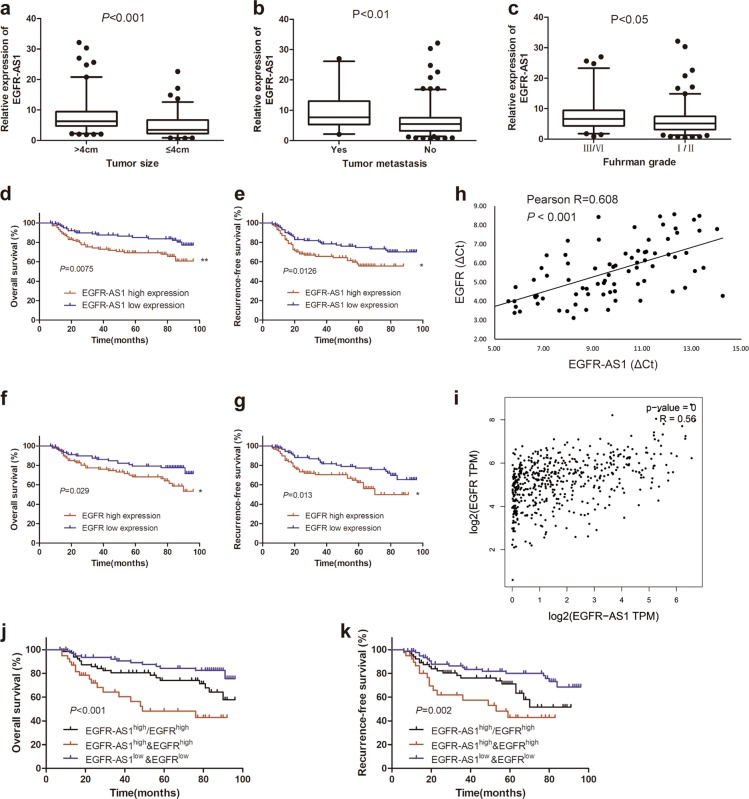
Fig. 6. Combining EGFR-AS1 and EGFR exhibits improved prognostic value.
a EGFR-AS1 expression between tumors >4 cm (n = 119) and tumors ≤4 cm (n = 85) in RCC samples analyzed using qRT-PCR. P < 0.001 by the Mann–Whitney U test. b EGFR-AS1 expression between RCC samples with tumor metastasis (n = 31) and without tumor metastasis (n = 173) analyzed using qRT-PCR. P < 0.01 by the Mann–Whitney U test. c EGFR-AS1 expression between Fuhrman III/IV grade (n = 52) and Fuhrman I/II grade (n = 152) RCC samples analyzed using qRT-PCR. P < 0.05 by the Mann–Whitney U test. d, e Kaplan–Meier analysis of the overall survival (d, P = 0.0075) or recurrence-free survival rate (e, P = 0.0126) of RCC patients with high or low EGFR-AS1 expression. f, g Kaplan–Meier analysis of the overall survival (f, P = 0.029) or recurrence-free survival rate (g, P = 0.013) of RCC patients with high or low EGFR expression. h, i The Pearson correlation analysis of the transcription level of EGFR-AS1 and EGFR in our data (h, n = 80, P = 0.038) and TCGA database(i, P = 0.019). j, k Kaplan–Meier analysis of the overall survival (EGFR-AS1high&EGFRhigh vs EGFR-AS1high/EGFRhigh and EGFR-AS1low&EGFRlow, P < 0.001) or recurrence-free survival rate(P = 0.002) of RCC patients with high or low EGFR-AS1 and high or low EGFR

