
Fig. 3.
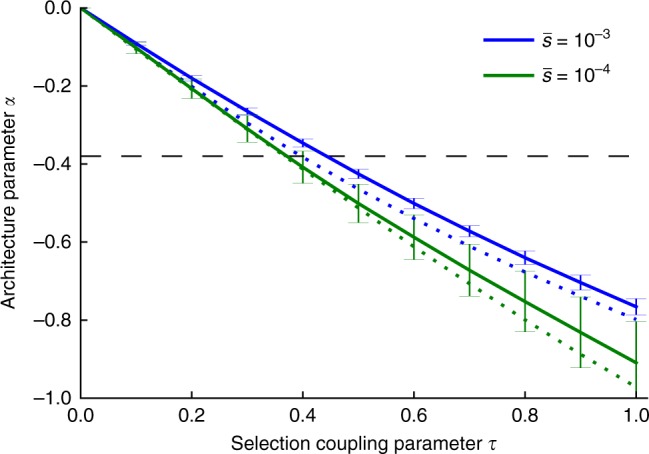
Value of α as a function of τ and other parameters in forward simulations. We report best-fit α estimates for simulations at each value of τ at a given genome-wide average selection coefficient . Selection coefficients were sampled using a gamma distribution shape parameter of k = 0.25 (solid lines) or k = 0.125 (dotted lines). α estimates where calculated by fitting the model in Eq. (1) to simulated SNP effects above twice the MAF threshold (in order to avoid edge effects near T), with error bars representing standard errors calculated by bootstrap resampling of 25 independent SLiM2 simulations. The horizontal dashed line indicates α = −0.38, the best-fit α across the 25 UK Biobank traits. Results for a broader range of k values are reported in Supplementary Figure 5. Source data are provided as a Source Data file