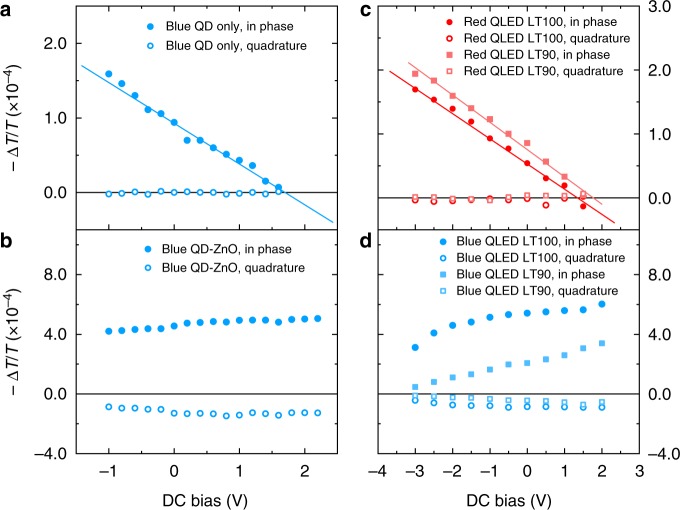
Fig. 5.
The origin of charge modulation. a DC bias-dependent elecctro-absorption (EA) signal of the sample with a structure of ITO/blue (Cd1−xZnxS) QDs/Al. b DC bias-dependent EA signal of the sample with a structure of ITO/blue (Cd1−xZnxS) QDs/ZnO/Al. c DC bias-dependent EA signal of a standard red device which is measured before and after the lifetime test. d DC bias-dependent EA signal of a standard blue device which is measured before and after the lifetime test. The probing wavelength is 570 nm for red (Cd1−xZnxSe1−ySy) dots and 455 nm for blue (Cd1−xZnxS) dots. The straight lines are indicators of the linear relationship between signal strength and applied bias

