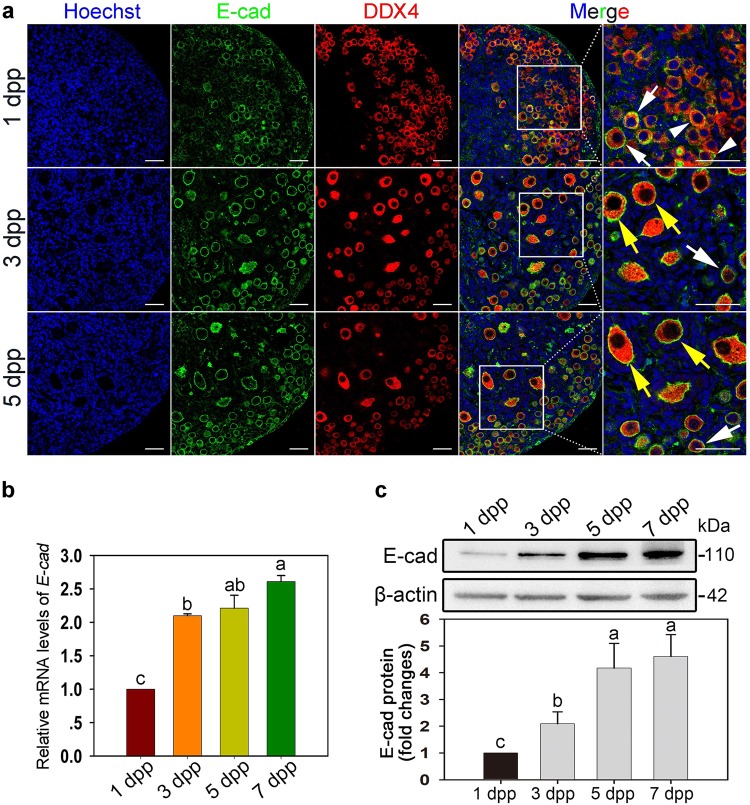
Fig. 1. E-cad expression pattern in the neonatal mouse ovaries.
a Cellular localization of E-cad in ovaries. Ovaries were stained for E-cad (green) and the oocyte marker DDX4 (red) at the indicated time points. The nuclei were counter-stained by Hoechst (blue). E-cad was mainly localized to the cytomembrane of oocytes in both primordial follicles (white arrows) and growing follicles (yellow arrows). b qRT-PCR assay showed that E-cad mRNA increased at 3 dpp. c Western blot assay showed that E-cad protein expression was increasing from 1 dpp to 7 dpp. The experiments were repeated at least three times, and representative images are shown. The data are presented as the means ± S.D. and considered statistically significant at P < 0.05. Scale bars: 50 μm

