Figure 7.

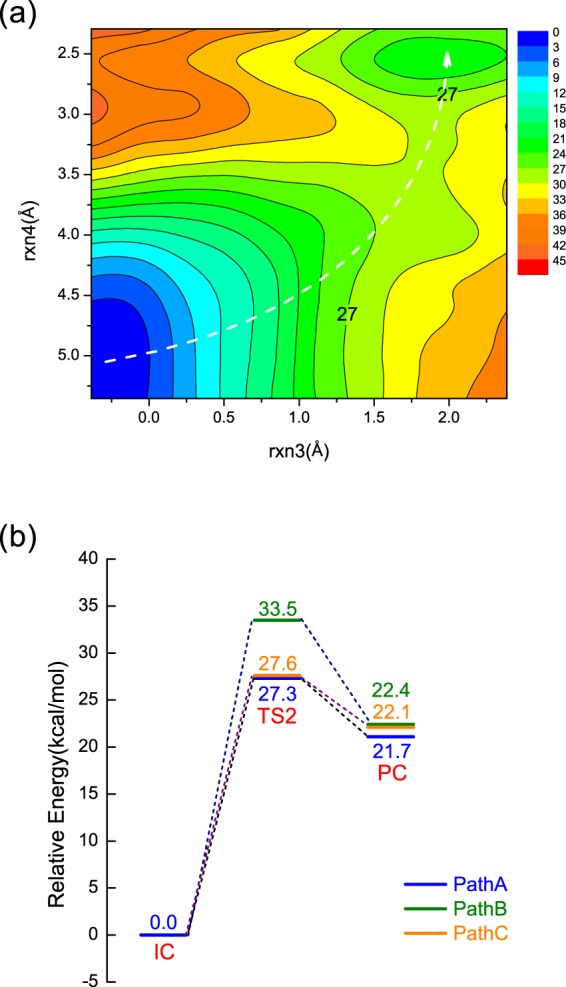
(a) Free energy contour plot for PathA of NanA. Energies are in kcal/mol. The white dashed line illustrates the minimum free energy path; (b) Free energy profiles for PathA (blue), PathB (green) and PathC (orange) of NanA.

(a) Free energy contour plot for PathA of NanA. Energies are in kcal/mol. The white dashed line illustrates the minimum free energy path; (b) Free energy profiles for PathA (blue), PathB (green) and PathC (orange) of NanA.