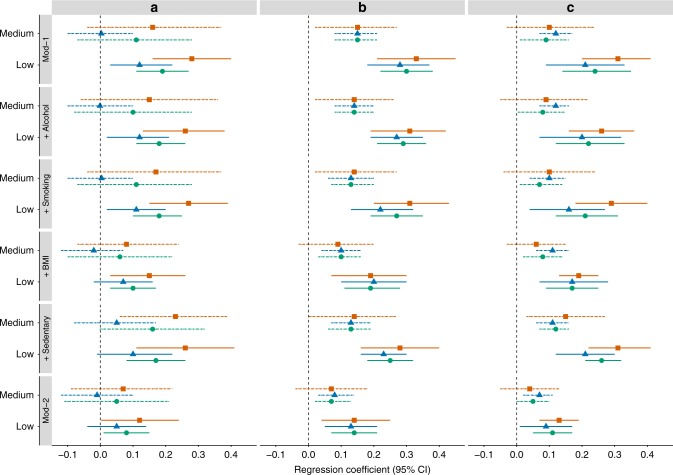
Fig. 2.
Forest plot of regression coefficients [95% confidence interval] for the association between a father’s occupational position, b participant’s educational attainment, c participant’s last occupation and CRP concentration at baseline in random effect meta-analysis framework for the total population and by gender for Model 1 (Mod-1), after adjustment for each intermediate factor (+Alcohol, +Smoking, +BMI, +Sedentary) and further adjusted for all intermediate factors together (Mod-2). The high SEP group was used as reference, solid lines represent the medium SEP group and dotted lines the low SEP group. Meta-analyses results for the total population (in orange) includes N = 13,078 for early life SEP and N = 23,008 for later in life SEP, respectively, N = 7798 and N = 12,809 for men (in blue) and N = 5280 and N = 10,199 for women (in green)

