Fig. 8.
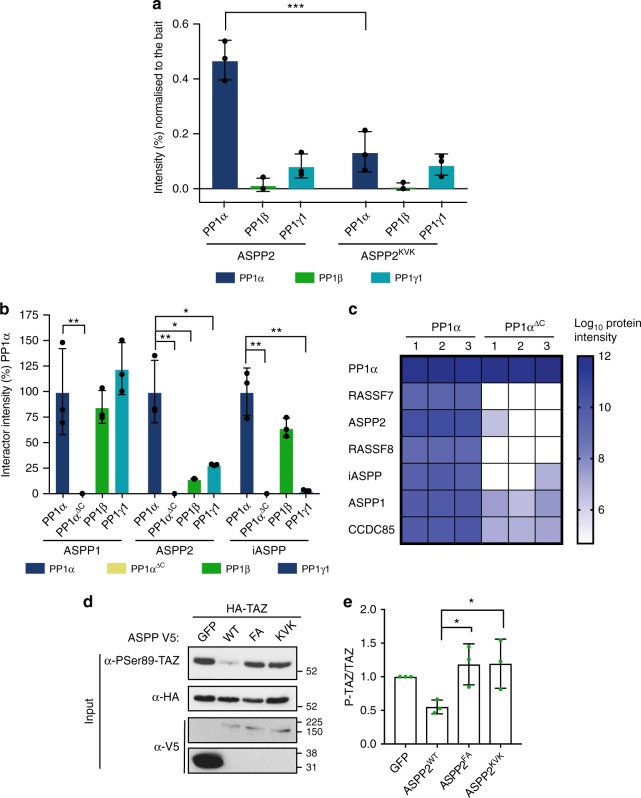
Function of the ASPP2 SH3 domain/PP1α C-tail interaction. a Quantitative AP-MS from HEK293T cells expressing Strep-HA tagged ASPP2 or ASPP2KVK. Chart shows protein abundance normalised to the bait (%) relative to PP1α, PP1β, PP1γ1. Protein abundance is measured on the basis of the average intensity of the three most intense and unique peptide precursors. Error bars indicate the standard deviation. A two-way ANOVA test was done to determine if the differences among means were significantly different from each other. Three pairwise comparisons were carried out (ASPP2 PP1α vs ASPP2KVK PP1α, ASPP2 PP1β vs ASPP2KVK PP1β and ASPP2 PP1ɣ1 vs ASPP2KVK PP1ɣ1) and p-values were adjusted using Bonferroni correction. Significant differences are marked. *** indicates p < 0.0001. b Quantitative AP-MS from HEK 293T cells expressing Strep-SH tagged PP1α, PP1αΔC (PP1α1-300), PP1β and PP1ɣ1. Protein abundance of ASPP1, ASPP2 and iASPP is measured on the basis of the three most intense and unique peptide precursors. Each intensity value is normalised to the respective bait and to PP1α. Error bars indicate standard deviation. A two-way ANOVA was done to determine if differences among means were significantly different from each other. Three pairwise comparison among each group were carried out (PP1ɑ vs PP1ɑΔC, PP1ɑ vs PP1β and PP1α vs PP1ɣ1) and p-values were adjusted using a Bonferroni correction. Significant differences are marked. * indicates p < 0.05, ** indicates p < 0.005. c Comparison of PP1α and PP1αΔC protein interactions. Heatmap of ASPP2-PP1 complex proteins intensity after purification with PP1α or PP1ɑΔC. d Western blot of transfected HEK293T cell lysates probed with the indicated antibodies. e Quantification of the ratio between P-TAZS89 and total HA-TAZ protein levels normalised to control phosphorylation. Error bars represent standard deviation. A one-way ANOVA test was carried out to determine if the differences among means were significantly different from each other. Two pairwise comparisons were carried out (ASPP2wt vs ASPPFA and ASPPwt vs ASPPKVK) and p-values were adjusted using a Bonferroni correction. Significant differences are marked. * indicates p < 0.05 (n = 3 independent experiments)

