
Fig. 8.
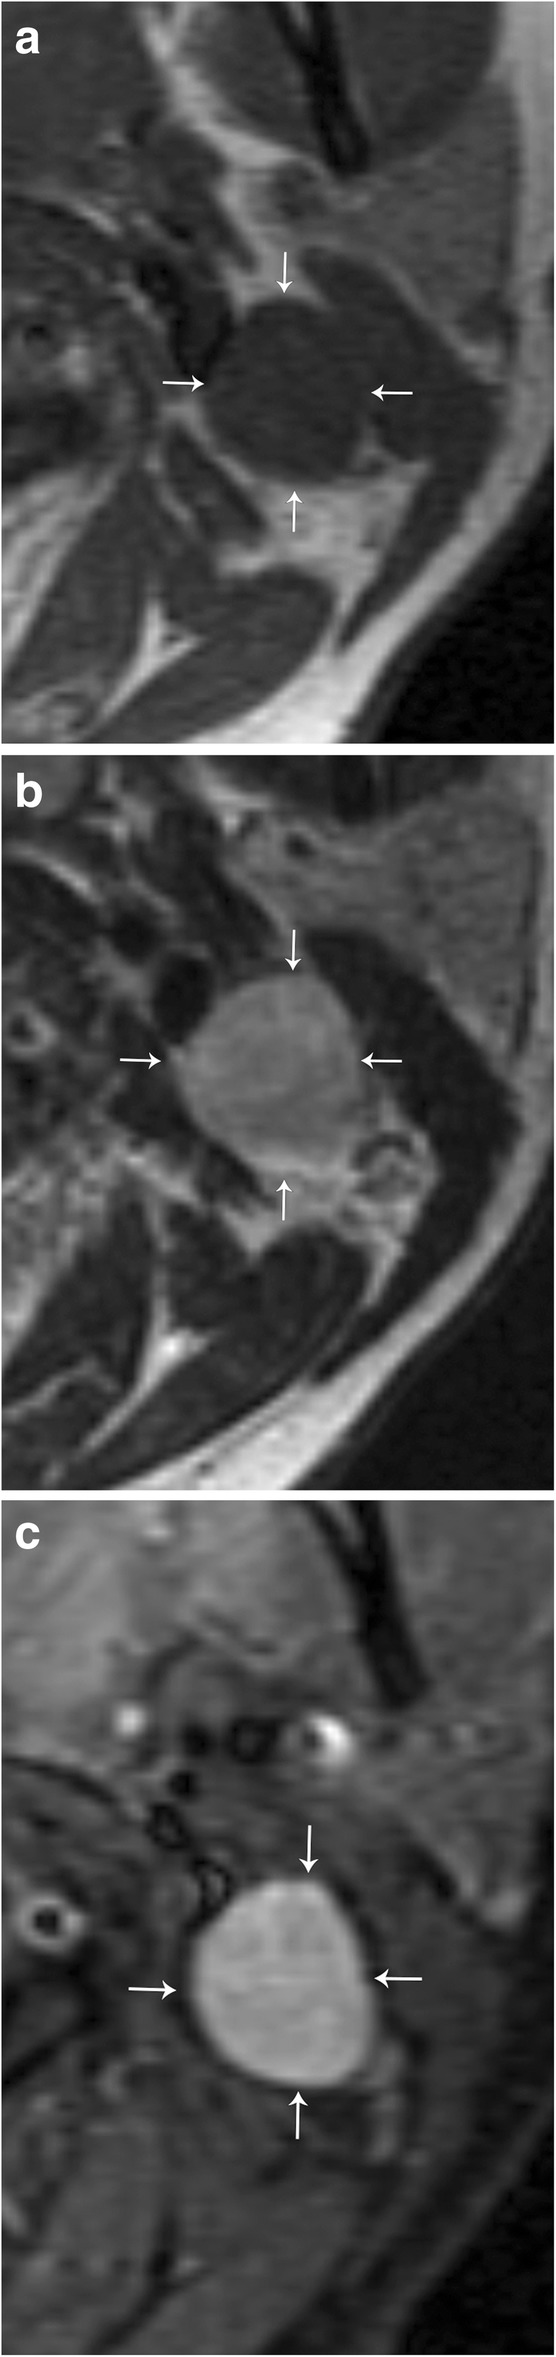
Schwannoma. a Axial T1 weighted MR image shows a well-circumscribed mass (arrows), which is low in signal. b T2-weighted MR image show that this mass is T2 hyperintense (arrows). c Post-contrast T1-weighted image shows avid and uniform enhancement of the mass (arrows)