Figure 4.

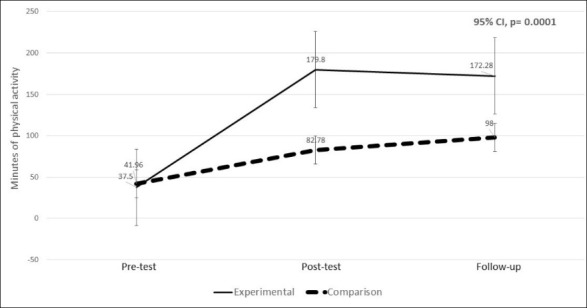
Changes in mean scores for MTM construct of changes in physical environment from pre-test, post-test to follow-up for experimental and comparison groups.

Changes in mean scores for MTM construct of changes in physical environment from pre-test, post-test to follow-up for experimental and comparison groups.