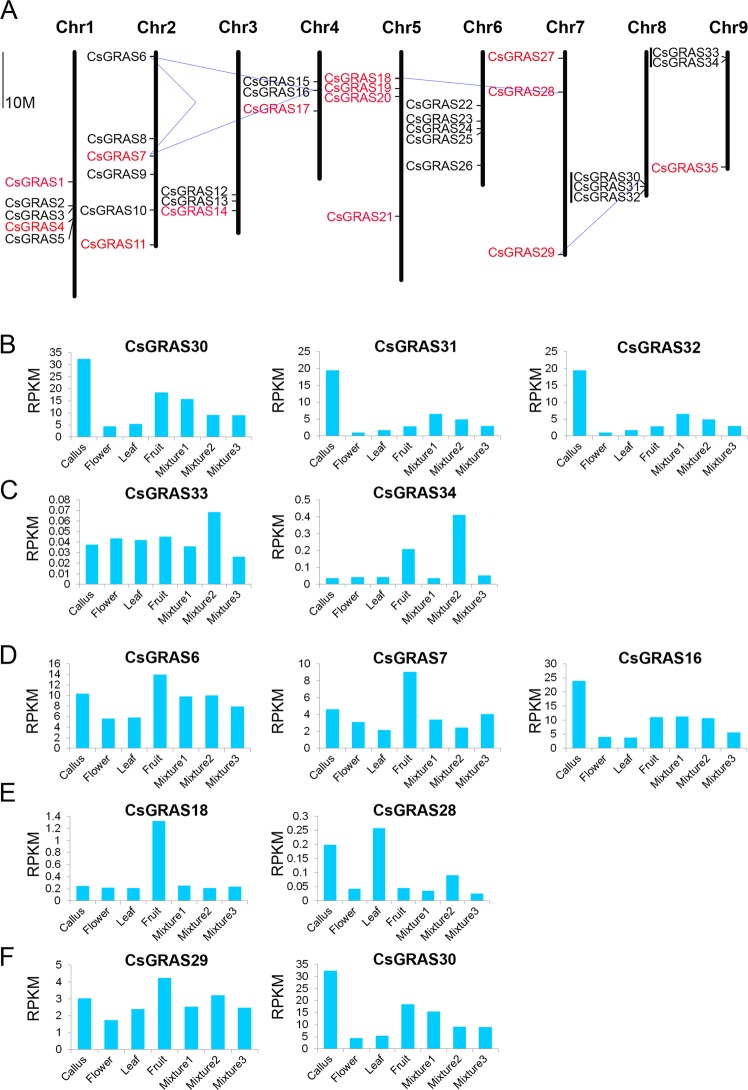
Figure 4.
Genomic distribution of CsGRAS genes and expression patterns of CsGRAS duplicated genes. (A) The scale on the left is 10 megabases (10 Mb). Chromosome number is indicated at the top of each chromosome. Black and red show the forward and backward direction of transcription. The CsGRAS genes representing segmentally duplicated genes are connected by blue lines and the tandem duplicated genes are highlighted by dark lines on the left. The position of each CsGRAS gene on chromosome pseudomolecules in base pairs are given in Table S1 in electronic supplementary material. The expression levels of tandem duplicated GRAS genes (B,C) and segmentally duplicated GRAS genes (D–F) were analysed in C. sinensis annotation project database of Huazhong Agricultural University (http://citrus.hzau.edu.cn/orange/).

