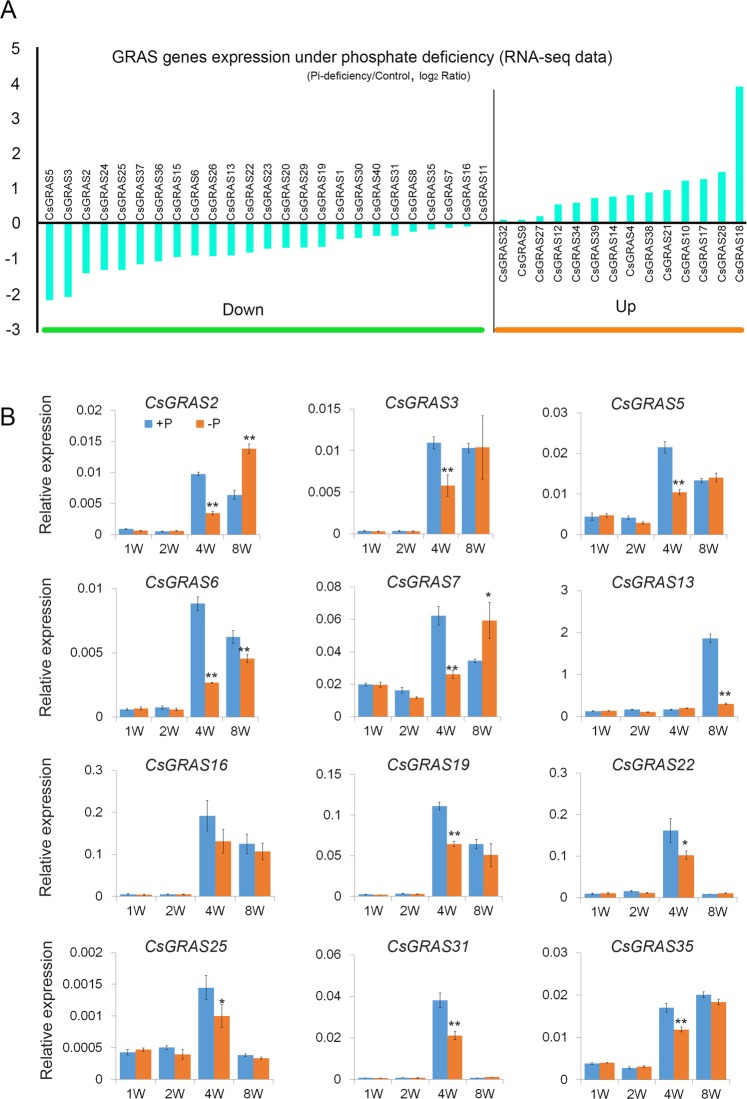
Figure 7.
The GRAS genes expression under Pi-deficiency in P. trifoliata. (A) The value was RNA-seq (RPKM) which deal with the Pi-deficiency data divided by the control data, and was transformed by log2 fold change. (B) Expression level of 12 CsGRAS genes under Pi-deficiency treatment at 1W, 2W, 4W and 8W, with the Citrus actin gene as internal control Error bars denotes the standard deviation calculated from three independent experiments, statistical significance were analyzed by Student’s t-test (∗∗p < 0.01, *p < 0.05).

