
Fig. 2.
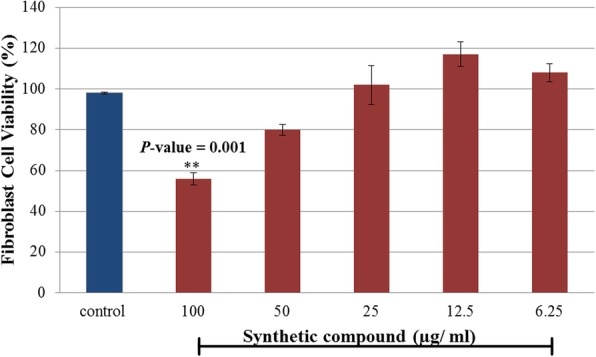
Comparison of the effect of CNBP compound on fibroblast cell viability. The data (in triplicate) are represented as the mean ± SEM. **p < 0.01 with the untreated cells (control)
Official websites use .gov
A
.gov website belongs to an official
government organization in the United States.
Secure .gov websites use HTTPS
A lock (
) or https:// means you've safely
connected to the .gov website. Share sensitive
information only on official, secure websites.
Comparison of the effect of CNBP compound on fibroblast cell viability. The data (in triplicate) are represented as the mean ± SEM. **p < 0.01 with the untreated cells (control)