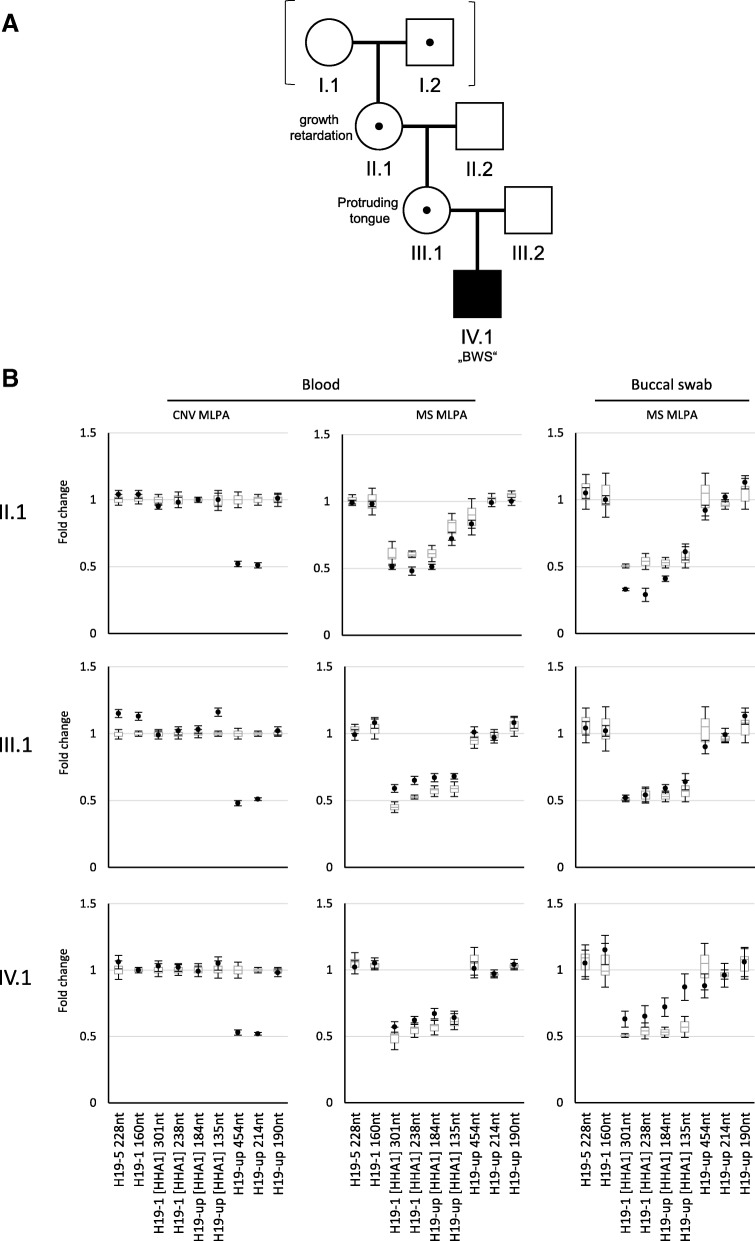
Fig. 1.
MS MLPA results showing GOM and LOM of the H19/IGF2:IG-DMR within the same family (a) with a deletion within the IC1. (b) In the MLPA copy number run (CNV MLPA), heterozygosity for the deletion is visible, whereas in the methylation specific run (MS MLPA) either LOM or GOM could be demonstrated. It should be noted that the MS MLPA probes are not affected by the deletion. The findings from lymphocyte analysis could be confirmed in buccal swab DNA. (Box plots showing the first to the third quartile of the data from healthy controls. The horizontal line with in the plots marks the median copy number or methylation, respectively. The data from the patients are shown as black dots. The whiskers of the box plots and dots indicate the standard deviation)

