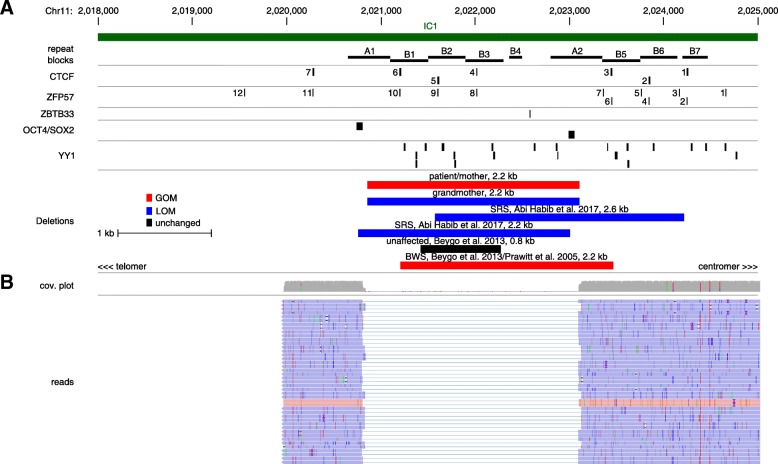
Fig. 2.
The exact position of the pathogenic IC1 deletion could be identified by nanopore sequencing and alters transcription factor binding sites (https://genome.ucsc.edu/). a UCSC custom track of the IC1 in 11p15.5 (hg19), illustrating the localization of the A and B type repeats as well as CTCF, ZFP57, ZBTB33, OCT4/SOX2 and YY1 binding sites (different distributions on forward and reverse strand are not shown). Additionally, the localization of the deletion in our family and in selected patients with IC1 deletions from the literature are shown (black boxes: position of transcription factor binding sites and repeats; red horizontal bars: deletions leading to GOM; blue horizontal bars: deletions associated with LOM; black horizontal bars: unchanged methylation). b IGV view from the affected region of the IC1 showing the coverage plot and some of the reads from the nanopore sequencing harbouring the deletion

