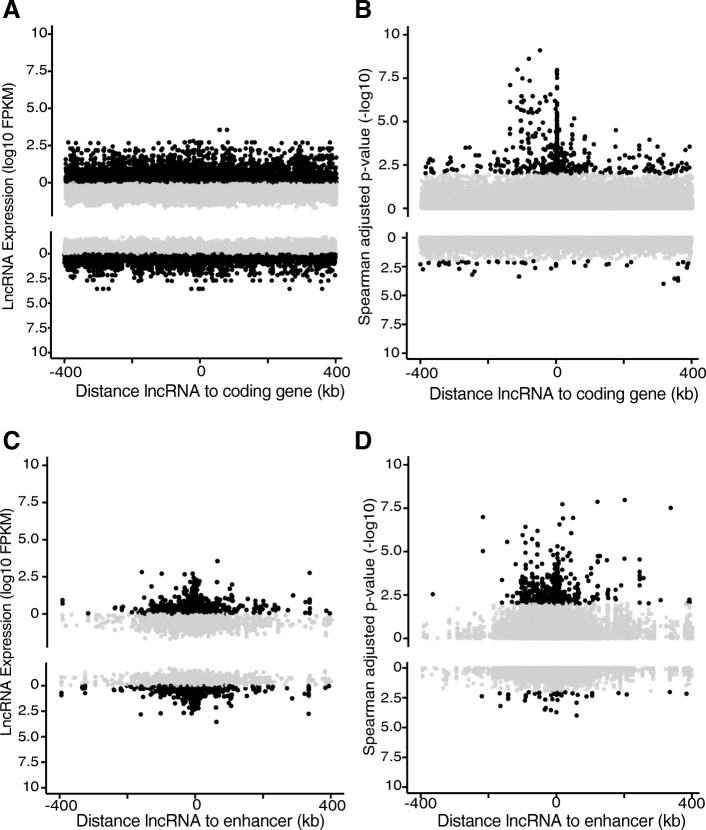
Fig. 3.
PLAIDOH reveals global patterns of LCP co-expression. LncRNA expression (log10 FPKM) (a & c) or LCP correlation (−log10 Spearman adjusted p-value) (b & d), are plotted relative to genomic distance from each lncRNA to a coding gene (a & b) or the nearest enhancer (c & d) within 400 kb regions flanking the lncRNA. LCPs with positive Spearman correlation coefficients (rho) are plotted in the upper half of each plot; those with negative Spearman correlation coefficients (rho) are plotted in the lower half. Black points highlight LCPs with adjusted Spearman p-values < 0.05 or FPKM > 1

