Fig. 4.
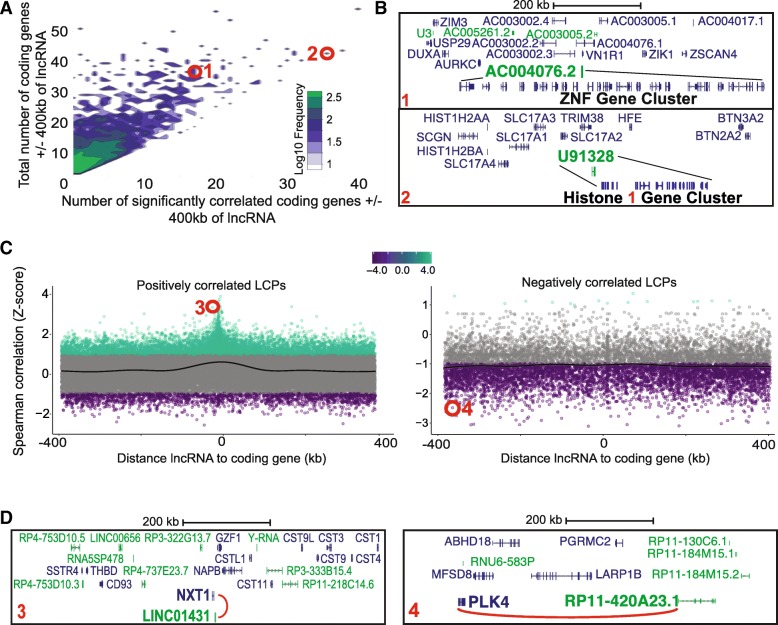
PLAIDOH ranks lncRNAs by number and fraction of correlated coding genes. a Contour plot shows the frequency of significant LCPs numbers as a function of the number of all possible coding gene pairs for each lncRNA. Color indicates increasing log10 frequency of LCPs at each x,y data point (white-blue-green). Highlighted in red are two LCPs in which single lncRNAs are each highly-correlated with large clusters of coding genes. b Genomic maps of the two LCPs shown in a. c Z-Scores of LCP correlation coefficients plotted by distance between each lncRNA and coding gene pair; positively correlated LCPs are plotted in the left panel and negatively correlated LCPs are in the right panel. Highlighted in red are LCPs in which single lncRNAs are correlated with only one coding gene. d Genomic maps of the LCPs shown in c

