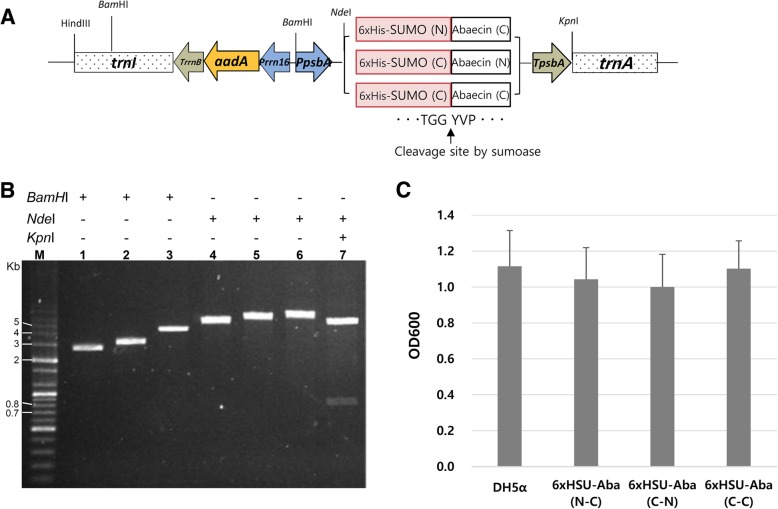
Fig. 1.
Construction of the expression vector and evaluation of the toxicity of 6xHisSUMO-abaecin fusion proteins to host cells. a Schematic diagram of the expression vector, pKSEC1. Prrn 16, 16S rRNA promoter; aadA, aminoglycoside 3′ adenylyltransferase gene; TrrnB, 3’ UTR of E.coli rrnB operon; PpsbA, psbA promoter and 5’UTR; TpsbA, 3’ UTR of the psbA gene; trnI, isoleucyl-tRNA; trnA, alanyl-tRNA. Three different fusion genes were cloned under the control of PpsbA. N, native sequence; C, codon-optimized sequence. The cleavage junction between SUMO and abaecin, which is recognized by sumoase, is presented. b Restriction mapping for the confirmation of vector construction of 6xHisSUMO-abaecin fusion gene. M, DNA size marker; Lane 1, digestion of pUC19 backbone vector by BamHI (2686 bp); Lane 2, insertion of PpsbA-TpsbA DNA fragment into the digested pUC19 and digestion by BamHI (3105 bp); Lane 3, insertion of Prrn16-aadA-TrrnB DNA fragment into the intermediate vector of lane 2 and digestion of the plasmid (Prrn16-aadA-TrrnB-PpsbA-TpsbA:pUC19) by BamHI (4576 bp); Lane 4, insertion of trnI DNA fragment into the plasmid of lane 3 and digestion of the plasmid (trnI-Prrn16-aadA-TrrnB-PpsbA-TpsbA:pUC19) by KpnI (5343 bp); Lane 5, construction of a new expression vector, pKSEC1, by the insertion of trnA DNA fragment into the plasmid of lane 4 and digestion of the vector (trnI-Prrn16-aadA-TrrnB-PpsbA-TpsbA-trnA:pUC19) by KpnI (6119 bp); Lane 6, cloning of 6xHisSUMO-abaecin into pKSEC1 and confirmation of the insertion by a single digestion with KpnI (6527 bp) and by double digestion with KpnI and NdeI (5708 bp and 819 bp) in lane 7. c Evaluation of toxicity of SUMO-abaecin fusion to host cells. Optical density (OD) values of overnight liquid cultures were compared between untransformed and transformed E.coli with three different 6xHisSUMO-abaecin:pKSEC1 constructs. Colonies of untransformed and transformed E.coli with each of the three different constructs were randomly picked from solid media and cultured in liquid media at 37 °C overnight and then OD values were measured at 600 nm next day. For the transformed E.coli, the liquid cultures were grown in both 100 μg/μl ampicillin and 50 μg/μl spectinomycin, while the untransformed one was cultured with no antibiotics. Each bar represents the mean and standard deviation values of three independent OD measurement experiments. DH5α, untransformed control; 6xHSU-Aba, 6xHisSUMO-abaecin; N, native sequence; C, codon-optimized sequence

