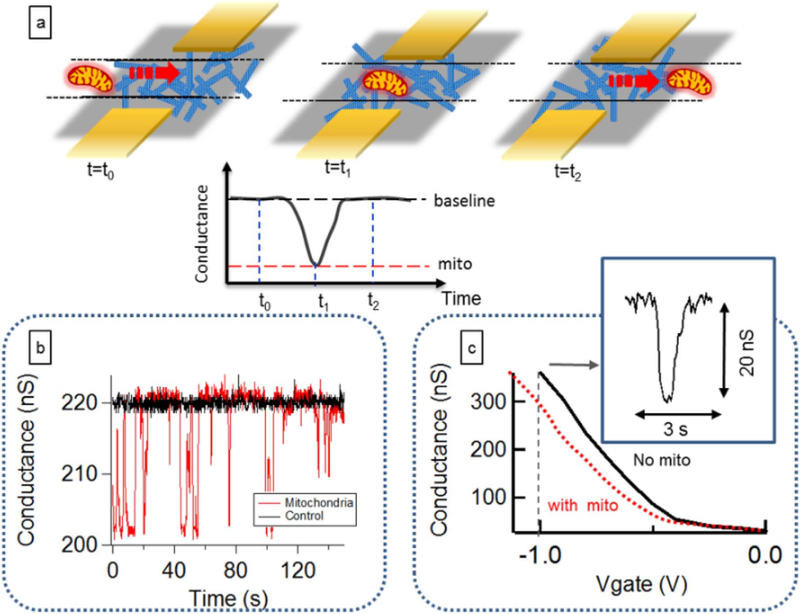
Fig. 3.

Carbon nanotube detection of vital, individual mitochondria. (a) As a mitochondrion approaches the nanotube electrodes, the source drain current starts to change, and when the mitochondria moves past the transistor channel area, the device current goes back to the baseline; (b) Conductance vs. time data recorded from a device without mitochondria in the flow buffer (black trace) and with mitochondria flowing in the channel (red trace). The spikes in the red curve correspond to mitochondria passing over the sensor area. This device is biased at a (liquid) gate voltage of −1 V; (c) The magnitude and direction of spikes depends on the gate bias voltage. The current change is negative for negative bias voltages, indicating a negative shift of the device threshold voltage as mitochondria approach the device. This has been reproduced nine times on nine separately fabricated devices. (For interpretation of the references to color in this figure legend, the reader is referred to the web version of this article.)
