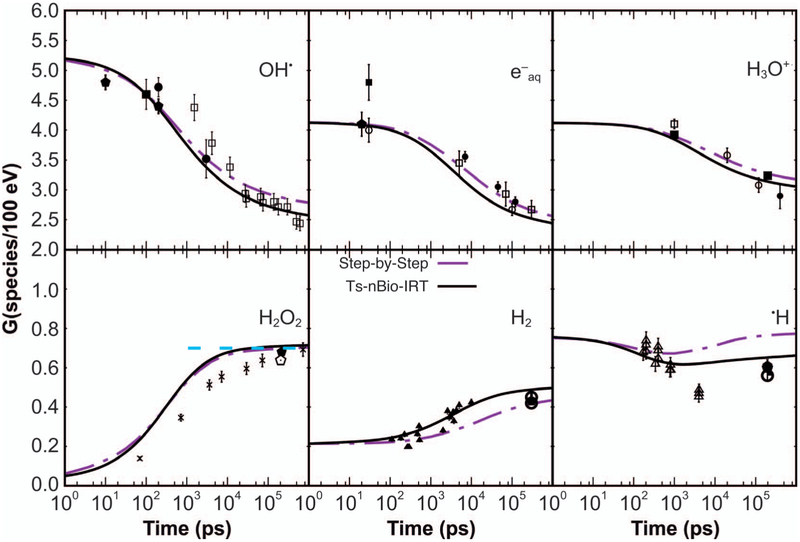
FIG. 6.
G values as a function of time for Geant4-DNA/TOPAS-nBio step-by-step simulation (dash-dot line) and IRT (solid line). Experimental data from different sources are represented by symbols. For •OH: (□) = 60Co γ rays (58), (■) = ~2 MeV electrons (59), (●) = 20–22 MeV electrons (60), the latter with data scaled by a factor of 0.8 [see (61)] and plus sign (+) = 7 MeV electrons (62). For e−aq: (□) = ~35 MeV electrons (63), (■) = ~45 MeV electrons (64), (◯) = ~40 MeV electrons (65, 66), (●) = ~2.9 MeV electrons (67) and plus sign (+) = 20 MeV electrons (68). For H3O+: (□) = 5 MeV electrons (69), (■) = 60Co and 8 MeV electrons (70), (◯) = 3.5 MeV electrons (71) and (●) = 15 MeV electrons (72). For H2O2, “X” indicates 60Co γ rays (58). For H2: (Δ) = 60Co γ-rays (73). For H• : (Δ) = 60Co γ rays (74). [Reprinted (and expanded) with permission. Ramos-Mendez J, Perl J, Schuemann J, McNamara A, Paganetti H, Faddegon B. Monte Carlo simulation of chemistry following radiolysis with TOPAS-nBio. Phys Med Biol. 2018; 63:105014.]

